Blog
Struggling to execute sustainability goals? It’s time to talk about tech

Shifting workloads from on-premises data centers to the cloud can significantly reduce carbon emissions, making the cloud a more eco-friendly choice. However, merely migrating workloads unchanged doesn't realise the full potential of carbon reductions that a cloud-based solution can offer. This is only possible by embracing a cloud-native approach.
In this article, we'll explore how an organization can reduce their carbon footprint by moving to the cloud and to cloud-native architectures.
The hyperscale data centers that power the cloud are able to achieve better power usage effectiveness (PUE) than typical enterprise data centers.
In 2023, Google reported a PUE of 1.10 for its data centers. This means that for every 1 kW of electricity consumed by the Google Cloud Platform (GCP) computing infrastructure, essentially the servers running the computation workloads and storing the data, an additional 0.10 kW is used to power the data centers infrastructure itself. The effectiveness of other cloud providers is in a similar range.
And to provide a comparison: Etsy, an international online marketplace for hand-crafted items, reported significant energy efficiency improvements when they migrated their software from a regular data center to Google's GCP. The old data center had a PUE of 1.39, which means that Etsy was able to reduce their carbon footprint by 20%, simply by moving to the cloud.
Load factor is a measure of how much of the total available server capacity is used. Better capacity planning and sharing workloads from many different parties with different usage profiles has allowed cloud providers to achieve a higher load factor, which results in lower overall carbon emission due to two factors.
Firstly, an idle server still requires energy. This means that at higher load a server uses proportionally less energy for the same computational load. Or, in other words, two servers running at 50% consume more energy than one server running at 100%.
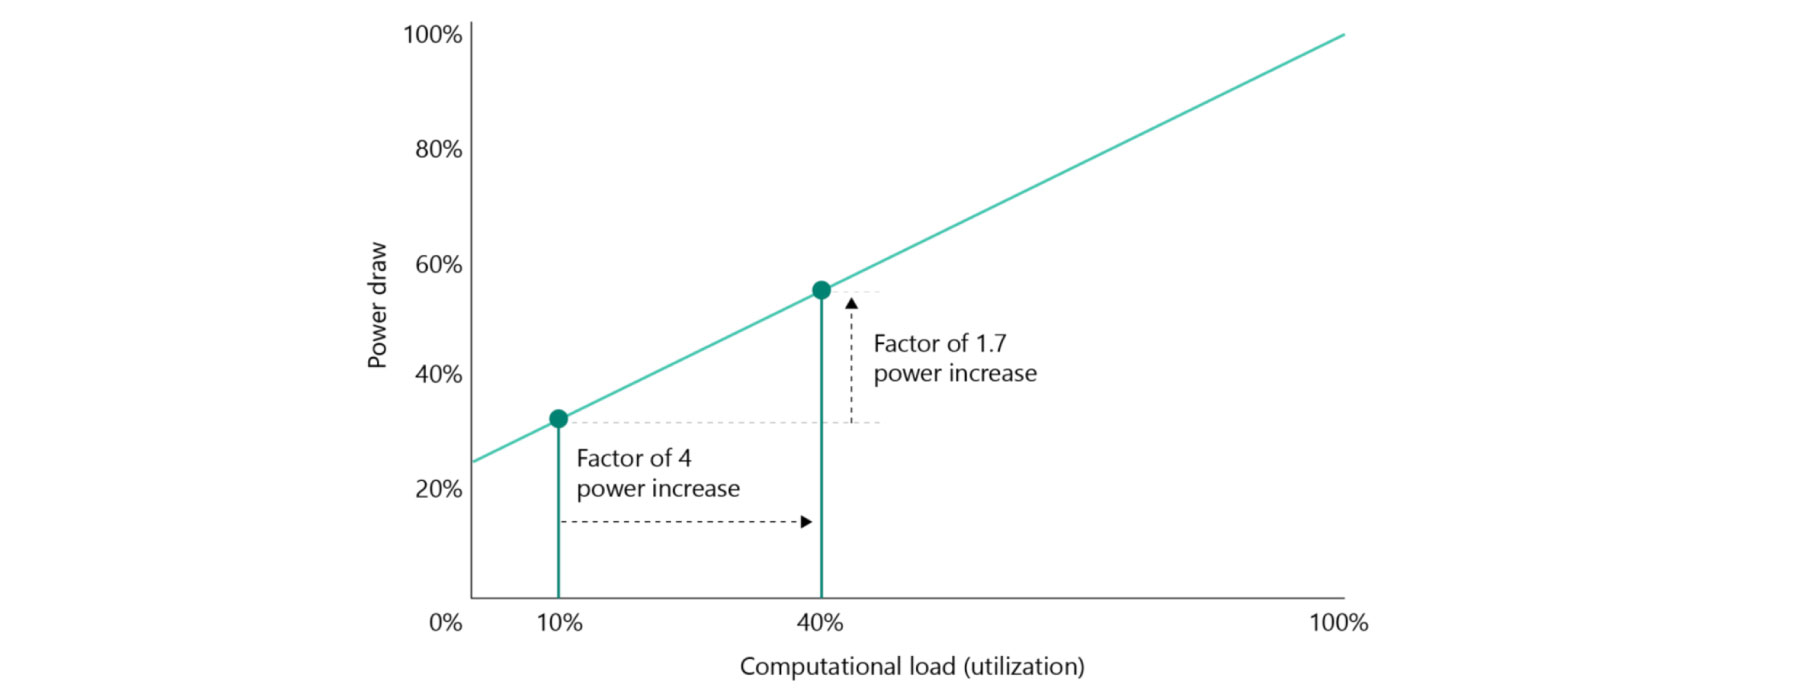
Figure 1: Credit-Microsoft Azure.Increasing the utilisation rate from 10 percent to 40 percent will allow a server to process four times the previous load, while the power draw by the server may only increase 1.7 times, achieving a high load factor and better energy proportionality
Secondly, with fewer servers the amount of embodied carbon is reduced. Embodied carbon represents the greenhouse gas emissions resulting from the production of the server, and it is a significant factor. A report commissioned by Dell, analysing the lifetime emissions of one of their server products, puts the embodied carbon at nearly 50% of the server's overall lifetime emission. This is an often-overlooked factor, and not all carbon emission reports include it.
Cloud infrastructure has a higher degree of elasticity than resources in a conventional data center. Organizations can add and remove resources with ease at short notice. This can be done manually, on a schedule – for example, releasing resources used by the development teams outside their working hours – or fully automatic by autoscaling the resources with some usage metrics.
In all of these cases, the resources not needed by one organization are returned, and can be used immediately by another organization. Servers generally don't sit idle for too long because organizations need hardware at different times, which means the cloud provider's hardware sees a higher overall use, which in turn results in fewer carbon emissions as described in the previous section.
One way to reduce carbon emissions of compute and storage workloads is to choose a time and place where the electricity grid mix is less carbon intensive, though deciding how best to schedule computation on increasingly heterogeneous resources while meeting other application objectives is a challenging optimisation problem. There are, however, several approaches to make applications more carbon aware at runtime.
To start with, if it's possible to choose where to run a given workload, then it's worth picking a region that has a less carbon intensive grid. Of course, moving a workload may have detrimental effects - increased latency for example.
Compute-heavy tasks are easier to move while data-heavy applications add to the carbon footprint because data needs to be transferred between regions. The transfer emissions must be considered even though it is difficult to quantify the full carbon emissions associated with data transfers.
A complementary approach is to pick a specific time for running compute-heavy workloads. This works because the electricity mix in most grids changes throughout the day, especially when the grid has a large amount of renewable sources. If a workload isn't time sensitive, such as certain batch processes or training of machine learning models, emissions are reduced by running the workload when the mix in the grid is less carbon intensive.
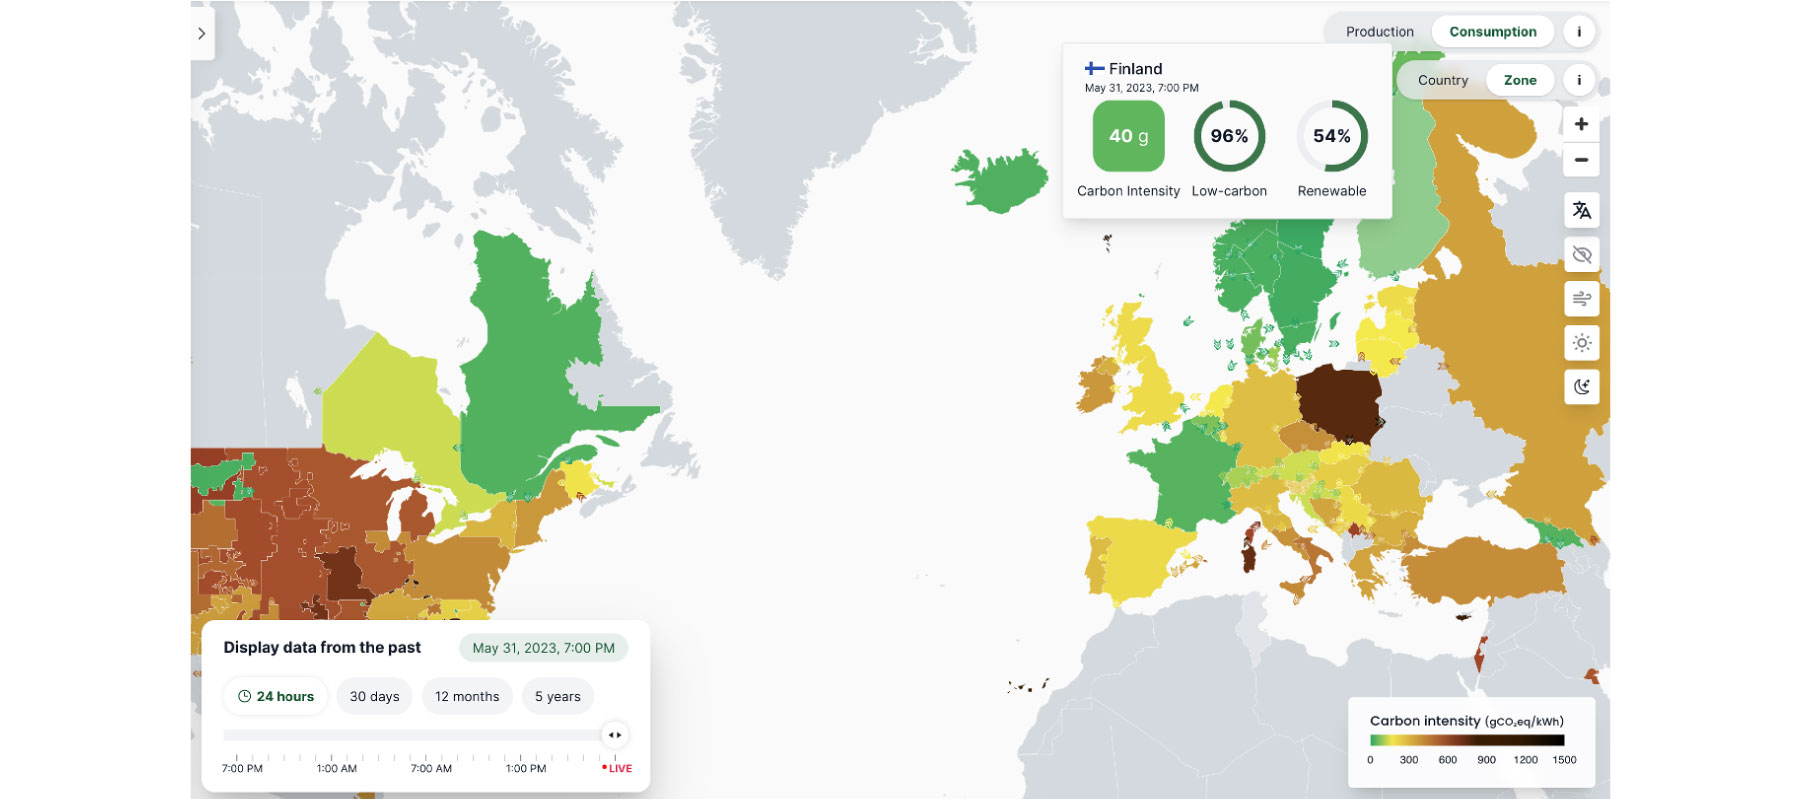
Figure 2: Credit - electricitymaps.com
Organizations must find a way to measure, or at least estimate, their carbon emission as a prerequisite for any strategy to reduce emissions. Cloud providers now offer tools that estimate carbon emissions tied to their customers’ workloads, though as each has its own levels of control and methodology they can be hard to compare.
To address this, Thoughtworks has developed the Cloud Carbon Footprint (CCF) tool, which estimates carbon emissions for cloud workloads across the major cloud service providers. Following a published methodology, CCF calculates emission estimates and provides a visualisation of the data over time. Cloud providers have started adding similar offerings to their platforms, but CCF has some unique characteristics: It's open-source, designed to be extended, works across multiple clouds and has a transparent, published methodology. In addition, it also includes estimates for scope 2 and scope 3 emissions.
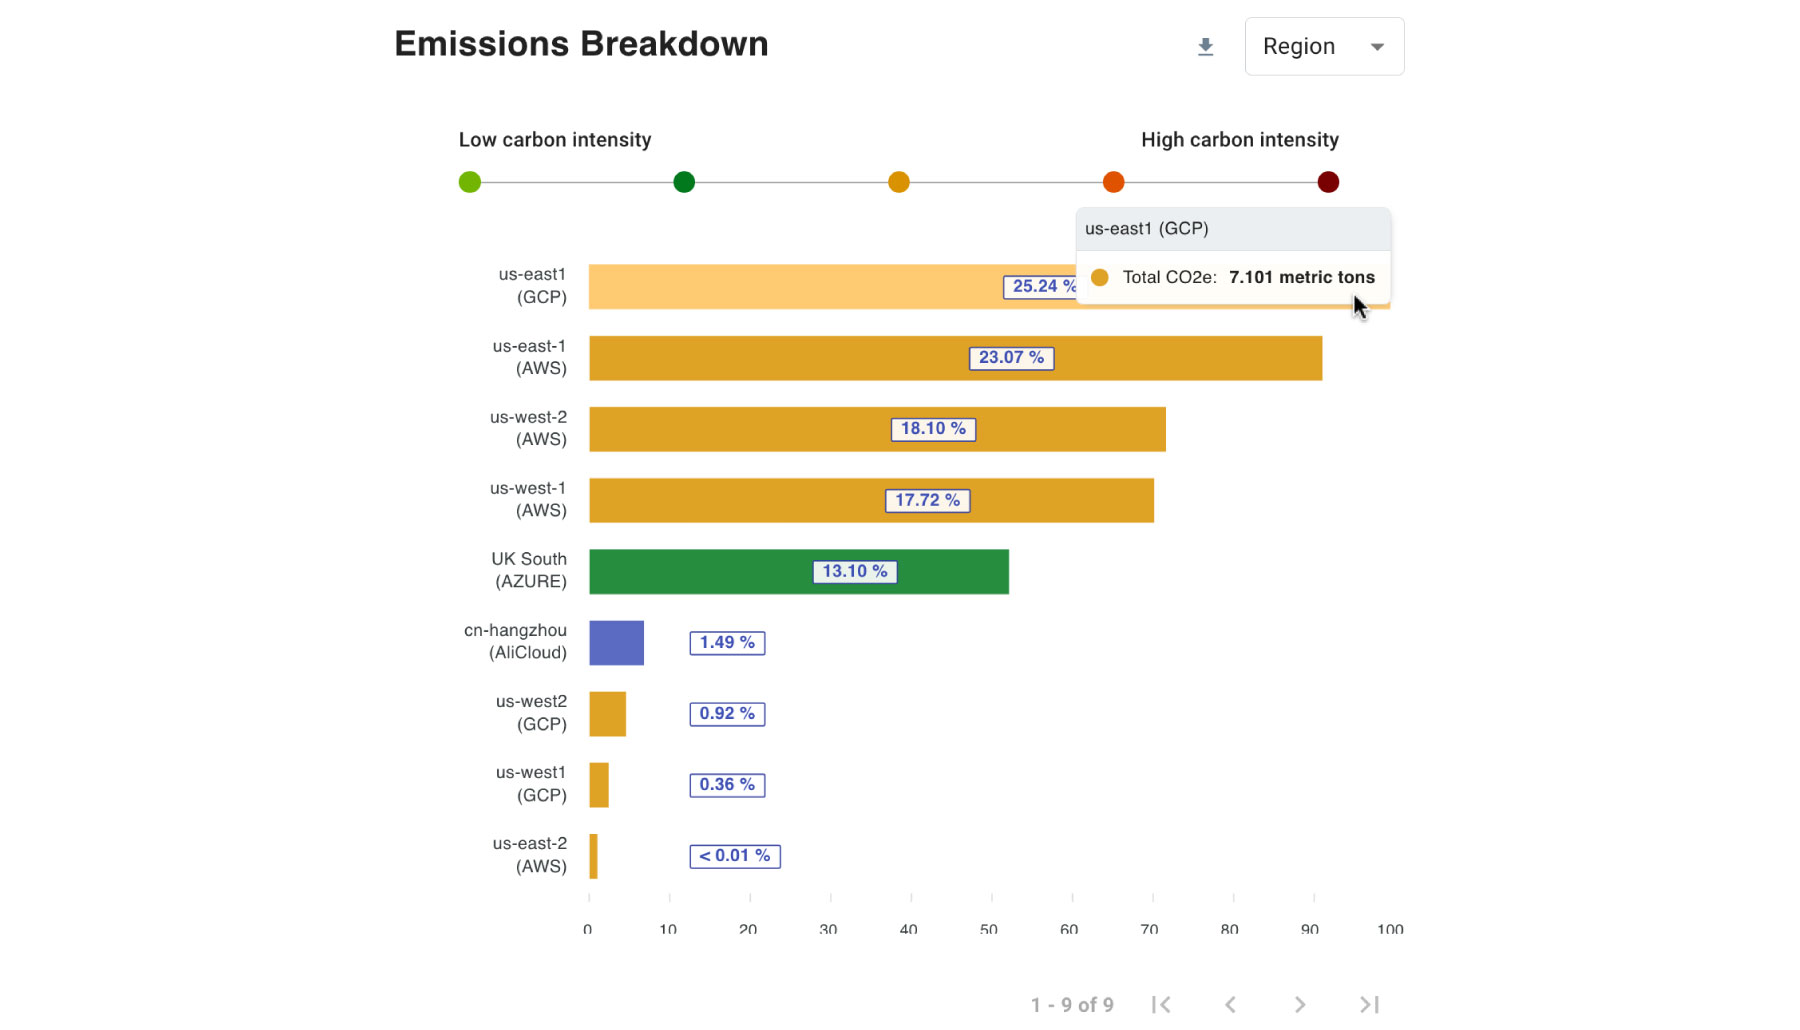
Figure 3: Credit-Cloud Carbon Footbprint.
Screenshot of an element of a dashboard provided by the Cloud Carbon Footprint tool
While these strategies can undoubtedly reduce our costs and improve our carbon footprint, it's essential to be mindful of the Jevons Paradox. Coined by economist William Stanley Jevons in the 19th century, this paradox suggests that as technological advancements improve resource efficiency, it can paradoxically lead to an unexpected increase in overall resource consumption. One example of this phenomenon is fuel efficiency improvements in aviation. Aircrafts getting more fuel efficient meant lower operating costs for airlines and potentially lower ticket prices for passengers. So people find air travel more affordable and they choose to fly more frequently. Paradoxically, this leads to an overall rise in consumption of aviation fuel.
This is why having a clear and comprehensive visibility of carbon emissions is crucial. The most environmentally friendly carbon emissions are the ones that never occur. It's our responsibility to adopt an engineering mindset and explore ways to achieve more with fewer resources, all while maintaining a keen eye on our emissions data. By taking a holistic approach that combines technological innovation with responsible engineering and policy interventions, we can strive for genuine sustainability while minimising the unintended consequences of increased efficiency.