
Cloud
Who is responsible for cloud security?

When building a software system, the focus tends to be on how it will be built and how much the development work will cost — cloud compute costs are, unfortunately, often overlooked but can be significant over time.
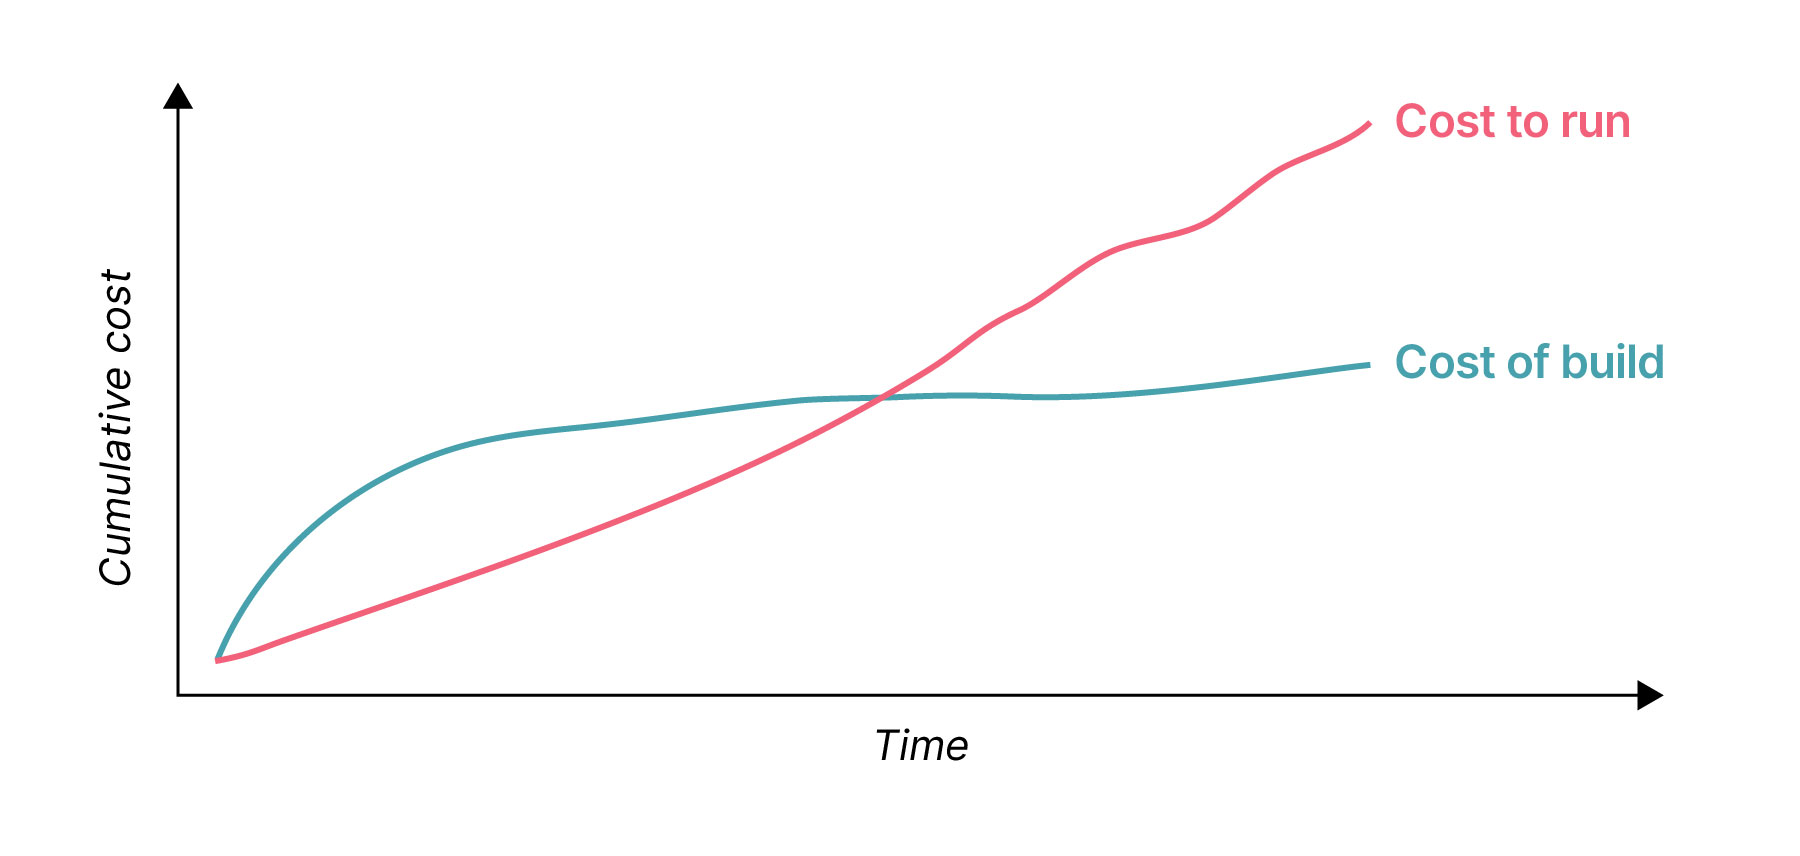
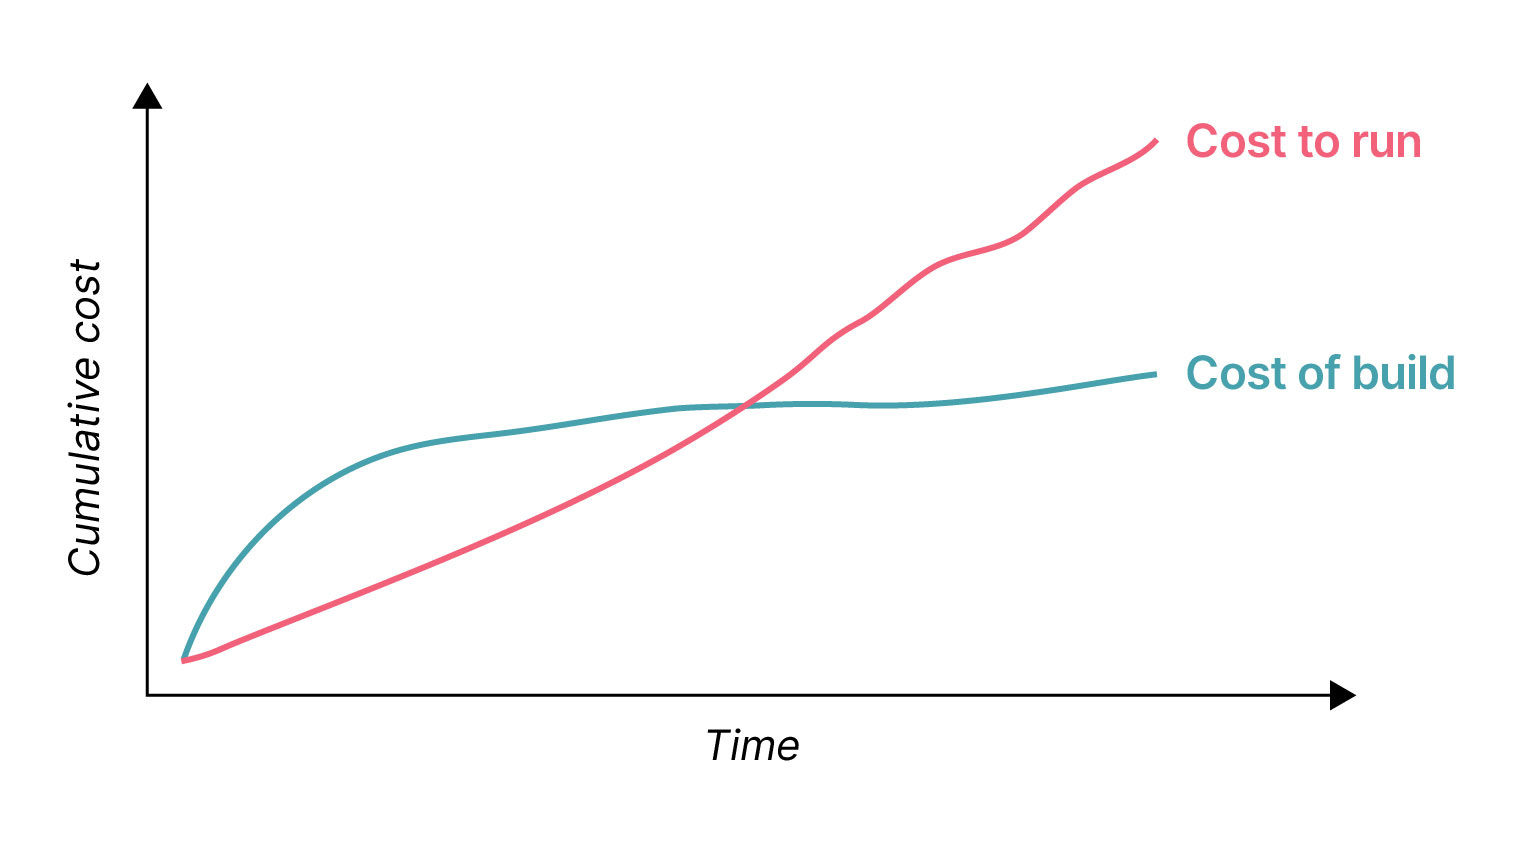
Related to this, it can also be tempting to fall into the trap of thinking the cost to run a system will just become obvious during the development cycle — however, because production workloads are typically very different to development workloads, this rarely happens. Estimating precisely how much a system will cost to run in the long-term requires substantial thought and effort.
This issue is particularly acute with a greenfield system. For a brownfield system, you at least have existing run cost and usage data as a starting point. With greenfield everything has to be estimated from scratch.
This certainly doesn’t mean doing so is impossible; it just requires a little care and attention. With that in mind, here are ten steps we think you should follow when estimating the run cost of a greenfield system.
In the rest of this piece, we’ll take a look at each one of these steps in more detail.
When you begin, you might not have any sense of how much effort it will take to get a good estimate of cost to run. This isn’t a problem, but it’s important not to overlook the work involved and try and rush things. Fortunately, you’re already on the right track — read the rest of this article and then to get a picture of everything you’re going to need to do.
Your cloud bill from your cloud provider will be broken down by services. Each service has its own pricing model. To estimate your cloud consumption, then, you need to figure out what these services will be.
You can start with a representative or important slice through your architecture. It’s worth noting that you don’t need to have chosen all of the technologies that you’ll use — you can make a model that involves, say, a streaming technology, and simply label it ‘streaming technology’. Then, when making your estimations, you can either build in some assumptions (perhaps, for example, you’re confident you’ll use AWS Kinesis Streams) or keep it open enough for other options to be included later.
What’s most important is that you have a conceptual diagram of the key components in your system, even if the model is incomplete.
Your system might be composed of different architectures which have different usage and cost profiles. It’s important that you break these down.
For example, maybe you have data pipelines running on a daily cycle. The cost for this is likely to vary based on compute usage, which will probably map to data volume and complexity. A web application, meanwhile, will typically have a cost profile that depends on user activity. To make sure you account for this variation, break the system down into subsystems.
Once you have identified the subsystems that make up your wider system, you then need to estimate how much data will be entering a given subsystem and how much user load it will receive. These are the big numbers that tend to drive all the pricing estimates. This isn’t easy, so let’s take a concrete example.
Let’s say we’re building an analytical dashboard that tracks administration of covid-19 vaccinations across England (my home country). Each record going into this system represents a covid-19 vaccination dose.
We will be ingesting records by messaging — this is typically priced according to the size and rate of messages. We also have a dashboard, which is a web app — pricing for that will depend on the volume of user activity. So let’s estimate how many records to expect:
How many records to expect?
We know there are about 56 million people in England and each should receive three doses. That would be 170 million doses. A fraction of the population will receive four or more doses. Some won’t take the vaccine. Let’s roughly assume those cancel each other out and go with an estimate of 170 million. We could refine our estimate with more research, but this can get us started.
How big will the records be?
Let’s say our data records where the dose was administered (full address), which vaccine was used and the date and time. An address in raw form is likely 50-100B. A time field about 20B. You can estimate raw size using text size calculators online. We only need raw size at this point. Probably we’ll track some more information like the NHS number, an identifier of the person receiving the dose and what type of location it was administered at (a hospital or a doctor’s surgery, for example). Let’s roughly say 300B — this is probably a little bit large but it’s better to overestimate by a little than to underestimate.
How will the records arrive over time?
The arrival pattern can make a difference because some cloud services have higher costs at peak load. To start to break down the pattern, let’s first consider volume per year.
The first two years of operation will probably be different from others — this is when most of the population will receive vaccinations. After that it will just be boosters for those considered vulnerable. So let’s just consider the first two years for now. Let’s take our 170 million records and spread them over two years — so 85 million per year.
Next we should think about when records will be entered. Probably not at night; let’s assume only in business hours and working days. So let’s say 85 million / 250 business days / eight working hours / 60 minutes / 60 seconds. That’s about 12 records per second.
There might be peaks within this period of a year, say if the records are uploaded as batch jobs. But if getting the data into the system is not urgent, and can be allowed to take hours and not minutes, then we can probably assume the peaks won’t greatly affect our cloud costs.
How many active users?
It’s an analytics dashboard and not an operational system. So it’s probably not going to be front-line staff entering the vaccination events. As said, we’re assuming the data will be fed in via automation. So only managers, administrators, planners and analysts will use it. Let’s say 50 users are likely to be active at any given time. Admittedly this is little more than a guess but it does get us started. We can test how much the error margins on our guesses matter in the next step.
Now we need to pick the components in the subsystems of our tech stack and price them one by one.
For example, we said in the last section that we’ll be ingesting data via messaging. Let’s say this is AWS Kinesis streams. We’ve said we’ll be receiving 12 records per second and each record is 300B. So that’s 12 x 300B, which is 3.6KB per second.
So, we can now go to the AWS pricing calculator and estimate the price. For example, we could enter something like this:
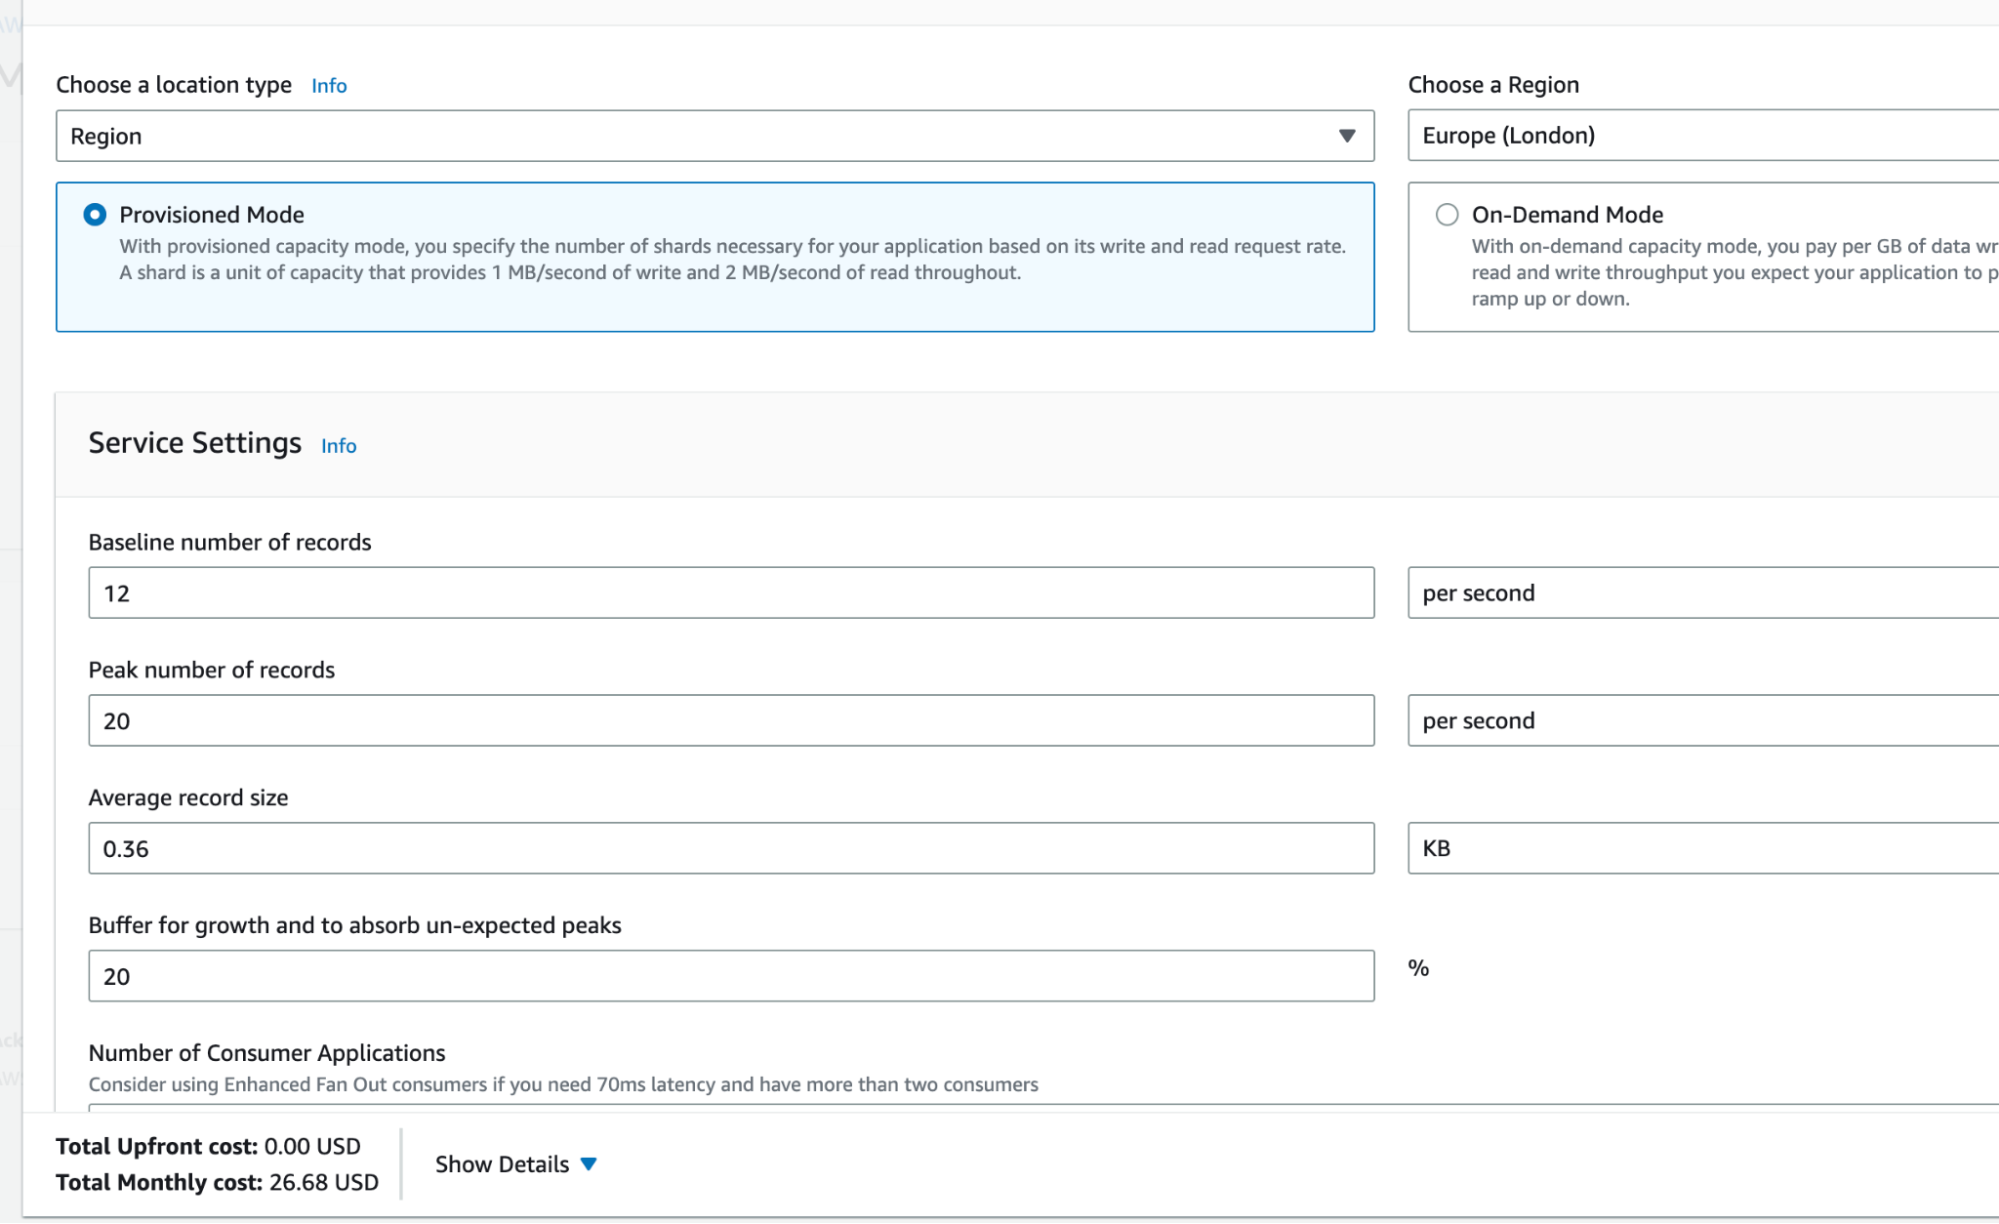
You might not know whether you want provisioned mode or on-demand mode. That’s okay — just do an estimate for each and record both. You want to get a rough upper and lower bound. It’s also fine to make simplifying assumptions for our purposes — you might, for example, assume a default 20% buffer.
We then need to go through the other components in our stack and estimate each in a similar way. Maybe we have S3 storage (priced based on volume per month). We said above that we’ll get 170 million records at 300B per record, so that will give us our upper bound for S3 storage. 170 million x 0.3 KB = 51 GB. But note that there’s also an S3 charge for transfer and that depends on the objects, so transferring a few large files is much cheaper than transferring a lot of small ones.
Let’s say our dashboard is running queries against AWS Athena. That is priced based on the amount of data being scanned in queries. So more queries scanning more data means we’re spending more. We’ve said we might have 50 users at a time. Let’s say they refresh every minute. That’s 50 users x eight working hours x 60 minutes per hour = 24000 queries per day. The average query probably won’t scan the whole 51 GB of data. Let’s say 0.1GB:
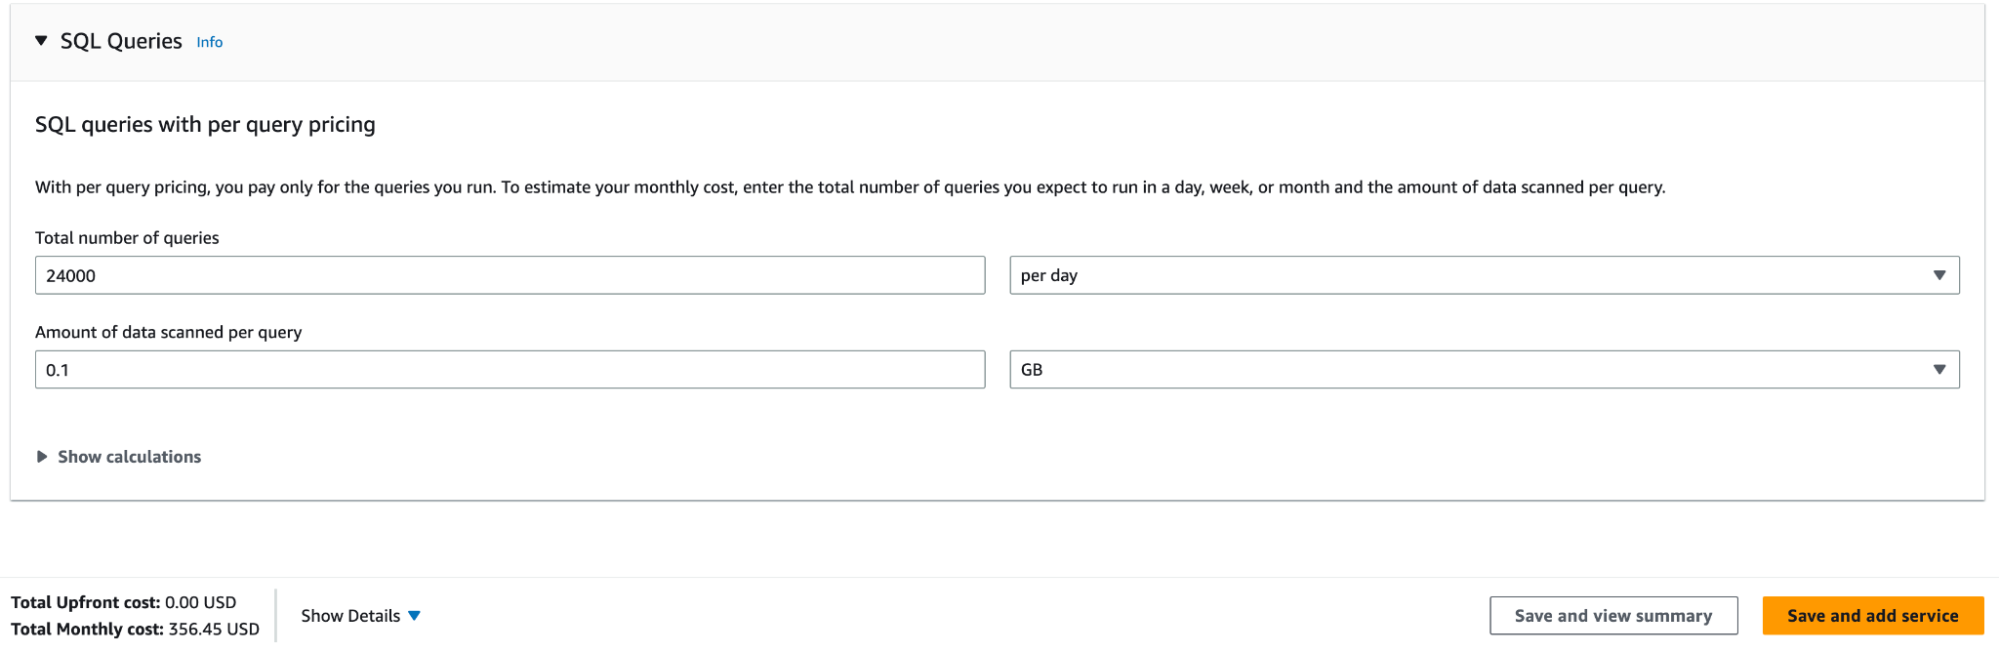
It’s important to note that this cost can go up rapidly if your queries scan a lot more data than you expect. We might, then, want to experiment with this later. For now, try an upper and lower bound, even if it looks absurdly approximate. You can refine it as you go.
Maybe you have other systems running with a similar profile; you can use their costs to get a sense check.
Maybe you have other systems using some of the same components in the tech stack. You can look at the costs for these components to gain a better understanding of where a cost may be coming from. For example, if you have another application running Athena queries, you can look at which queries scan what volume of data to get a better sense of how much data would be scanned in your greenfield application.
If the high end of your estimates are way beyond your budget then you might need to refine your estimates. Similarly, if the low end is pushing the limit of your budget then you need to take a closer look at your estimates. Either you’ve made a mistake or you’ll have to make an argument for cost optimizations or changing the budget. You may even have to just acknowledge that the project isn’t viable.
To make an argument for cost optimization, flip your reasoning: start with your budget and try to imagine what cost factors would push you over the limit. First, pick the component that contributes the most to your costs and try to get some confidence in your estimation. You can then reason that you have to spend at least this much on component X — that means you then know what budget you have left for other components.. Once you’ve done that, then take the next most significant component and do the same; use the upper and lower bounds of the component that you’ve already estimated. If you find that just a few components alone take you over your budget then that can make a powerful argument for cost optimization.
We talked earlier about estimating the volume of data scanned by an Athena query. You could take a set of representative queries and mock up some data and run the queries. You can also try to work it out by thinking about how much of the data you would expect to be scanned. A lot will depend on what filters are applied to the data and which queries will be run most frequently. Actually executing some code and seeing it running will give some evidential grounding to your reasoning.
Are you deploying across multiple regions? Are you using high availability / failover? These things are easy to overlook but can have a big impact on costs.
As you near the end of the process, there are a number of questions you need to ask:
You will probably have to deal with a lot of open questions and can’t expect certainty here. Don’t expect precision. Try to find what the big variables are that have the most impact. Then focus your time on learning what you can about those.
Disclaimer: The statements and opinions expressed in this article are those of the author(s) and do not necessarily reflect the positions of Thoughtworks.