
Data science and analytics
Trends in Big Data

This article assumes some prior systems theory knowledge, specifically terms like feedback loops, agents, stocks and flows.
"The team's delivery pace will decline significantly over the next two months but recover quickly afterwards. Without unexpected disruptions, they will continue improving slowly until the team reaches their stable performance limit in six months."
I shared this assessment in a call with one of our client stakeholders from a past engagement. Time proved the forecast to be accurate; delivery metrics hit their lowest point shortly before the 2-month mark and bounced into a steep improvement before curving into a gentle upward slope. This piece describes the mental models I used to formulate my hypothesis.
You don't need to trade your soul for a crystal ball to make a forecast like the one above, but you do need to understand some basics about systems theory. In a nutshell, a complex adaptive system — or CAS — is a group of interacting elements that collectively behave in a way that can't be explained by analyzing each of them individually. For example, a software system – excluding stochastic systems, like AIs – is not complex; you can understand and predict its behavior by thoroughly examining each component. Conversely, a team behaves like a complex system. While you can guess how people with different backgrounds, personalities and skills will collaborate, but there's no guarantee.
There's a crucial difference in how the complex and non-complex behave with failure and recovery. When a software system fails, you can typically trace the cause to a specific component; recovery then requires you — an external agent — to turn the system off and on again, or, for rare cases where that doesn't work, you have to repair the failed component.
Pinning failure on a specific team member only brings useless conflict, and the last time I checked, there's no reset button for people. This means you need to be more creative in a complex environment. Under the right circumstances, an individual can alter a system’s feedback loops to reinforce desired behaviors or mitigate undesired ones. Although systemic change is traditionally expected from managers, experience shows that enabling more people to enact change allows an organization to evolve faster.
A useful technique is systems mapping. To do it, you first, identify qualitative factors and situations affecting your organization. By qualitative, I’m referring to what you can't see on a neat dashboard or chart — the things that only come up in casual 1:1 calls with people, or in water cooler conversations and healthy retrospectives.
Next, think about second-order effects. These are the consequences of those qualitative factors, which have further implications and so on. Researchers have shown that second-order effects are a big blindside of the human brain; we think in terms of linear cause-and-effect and so often miss significant domino-effect repercussions. One way of making sure you’re sensitive to these second-order effects is to talk to people that have been in the organization for a long time. They're often the people who are most eager to share the types of stories that will help you draw connections between seemingly unrelated situations.
Your system map should be a live artifact. Revise it periodically to reflect new challenges and connections as you discover them.
Now come the insights from the exercise — and here's where the client’s story continues…
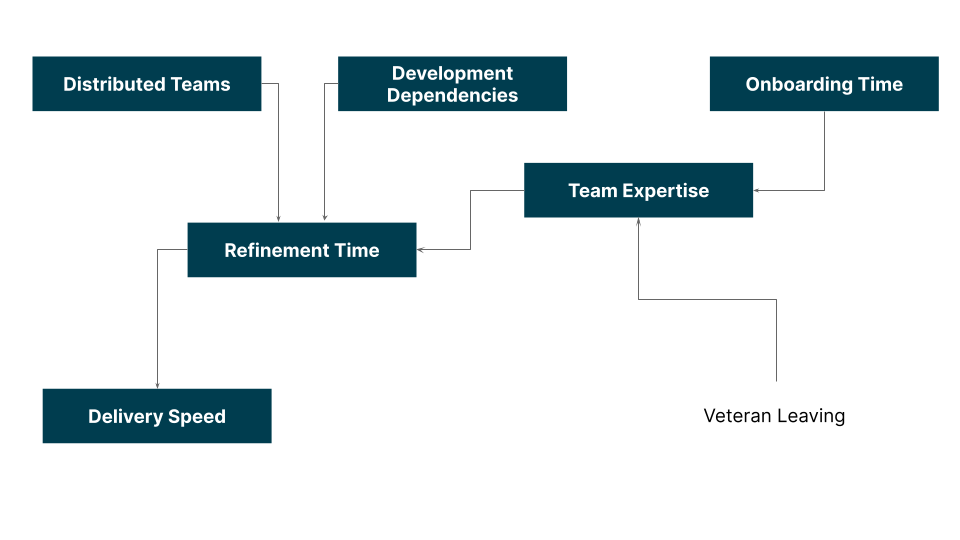
At the time of the presentation, we knew that a veteran team member was leaving; this would, we realized, lead to a drop in expertise, which — among other things — would negatively affect refinement sessions for new features by making them longer and increasing the risk of delays. The refinement problem would be further aggravated in the short term by several factors: first, the upcoming features in our roadmap, which suffered from unusually high dependencies with multiple teams in different timezones. Second, onboarding new developers with the accounts and permissions they needed took over a month on average.
Below you can see an extremely simplified snapshot of the map. Boxes represent persistent behaviors, situations or indicators; the free text represents a single event or incident, and the lines represent the influence of events or nodes on each other. It’s simple to expand the map with boxes representing subjective things like team morale, objective metrics like monthly incidents in a productive environment, and how each of those affects everything else. You could also upgrade lines to indicate the strength of the influence, for example, to say that dependencies have a stronger impact on refinement time than distributed teams with a thicker line.
Various people in different contexts mentioned all the situations identified. For most people in the organization, they were nothing new. The problem was that bringing this to business stakeholders usually led to the same question: what's the relative value of solving this against creating new customer-facing features? I chose delivery KPIs for my conclusive forecast because it was the number that would maximize the chance that senior management would take action, because our upcoming set of features were compliance-related and deadlines were non-negotiable.
So, if you complement a robust system map with good data, you’ll have more options for articulating business value to stakeholders. For example, you’ll be able to demonstrate how losing a team member could affect revenue, or how the lack of a good testing environment affects market share. I certainly don't recommend trying to calculate numbers that are accurate to the unit. Ultimately, the value of this exercise doesn't come from the forecast itself but from visualizing how, in a complex system, everything is connected and how a small change in one variable could have a massive impact somewhere else.
Disclaimer: The statements and opinions expressed in this article are those of the author(s) and do not necessarily reflect the positions of Thoughtworks.