


This is the second part in a two part blog series which talks about Twist execution hooks and customizable HTML reports. In the first post, we described collecting the step execution time and posting it in Twist data store. Here we will discuss customizing the HTML report to visualize the step execution timings.
Report templates
With Twist 13.1, every Twist project comes with a "report-templates" directory which contains the files used for generating HTML reports. When HTML reports are turned on, Twist will use the "report-templates" contents to make the HTML report. Twist generates the execution result as a JSON file. "report-templates/js/scenarios.js" contains a default rendering of this JSON data. To customize reports, you can either change this file or listen to the hooks provided by the default JS renderer. Changes made to the report templates will be applied when Twist generates HTML reports. This makes it easy and powerful to generate custom reports.
Customizing report templates
In this blog post, we will modify the existing "report-templates/index.html" to read the data store contents and plot a simple graph. "report-templates/index.html" already includes twist execution results and the execution results are available to you in a global variable named "twistExecutionDetails". You can take JS console and inspect the contents of this variable. Please refer to the documentation to understand the full JSON structure.
When a report is loaded in the browser and a scenario is displayed, Twist will execute the function assigned to "window.twist.onScenarioDisplayed". We can hook onto this function to render the graph after a scenario is shown.
window.twist.onScenarioDisplayed = function(scenario) {
renderStepExecutionGraph(scenario);
}
"renderStepExecutionGraph" handles the graph construction.
function renderStepExecutionGraph(scenario) {
if (scenario.dataStore) {
var data = [];
for (var i = 0; i < scenario.dataStore.keyValues.length; i++) {
var keyValue = scenario.dataStore.keyValues[i];
data.push(keyValue[1]);
}
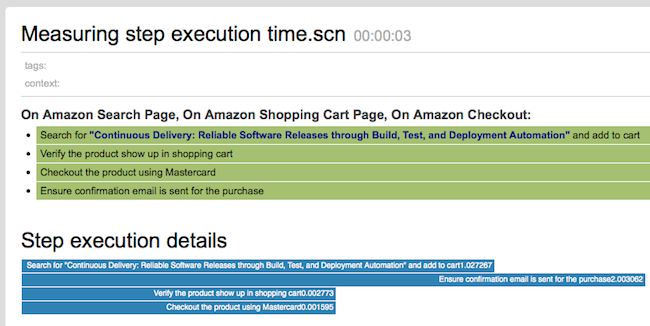
// Header for graphs
var h2 = document.createElement('h2');
h2.appendChild(document.createTextNode('Step execution details'));
document.getElementById("scenario_details_container").appendChild(h2);
// Graphs
var chart = d3.select("#scenario_details_container").append("div").attr("class", "chart");
var x = d3.scale.linear().domain([d3.min(data), d3.max(data)]).range(["400px", "800px"]);
chart.selectAll("div").data(data).enter().append("div").style("width", x).text(function(d,i) { return scenario.dataStore.keyValues[i][0];});
}
}The above function reads data store to get the values and uses d3.js to render the graph. You can use any charting library to render the graph.

"scenario_details_container" is the div where scenario details are displayed. The default renderer will add this div while rendering the scenario. Please refer to the documentation to learn more about the HTML elements that the default renderer creates.
With the graph in place, you don't need to show the datastore table. You can hide it using the following css.
<style type='text/css'>
 .data_store_container {
 display: none;
 }
</style>
This blog post only covers the basic customization capabilities. Report customization is very powerful and you can customize it in any way that you like. A detailed understanding about the JSON structure is necessary for any advanced customizations.
See what's new in Twist 13.1 on our community site or Try Twist now.
Disclaimer: The statements and opinions expressed in this article are those of the author(s) and do not necessarily reflect the positions of Thoughtworks.