
Data strategy
Why do data platforms fail?

As a global online classifieds organization, Adevinta has a wealth of data. Accessing it is possible through DataHub, a portal for open data. With it, teams can not only create, read, update, delete and integrate data, they can ultimately use it to unlock business insights and develop data products, machine learning (ML) models or for testing and experimentation. A core part of DataHub is the data catalog. This allows users to discover data, request access, and begin exploring it. It acts as a linchpin for many services within DataHub and is often the starting point for user journeys within DataHub.
A number of Thoughtworks consultants joined Adevinta’s Barcelona-based team to collaborate on the data catalog. Together, we were tasked with extending the functionality of the catalog and proving its value for the organization. As with any other internal delivery platform, proving the value of a data catalog can be challenging because it isn’t directly linked to the business goals of the organization or to customer value. In this blog post, we’ll explain how we tackled this challenge — doing so meant the team we worked with at Adevinta was well-placed to communicate and illustrate the value of the data catalog to users.
A typical way of measuring the value of a digital product is to understand the business process. You might, for example, measure how long it takes your users to accomplish their goals and set this as a baseline.
Once you have set the baseline, you can then measure whether your product improves this process. We started the discovery phase of the project trying to understand how users at Adevinta discover data. It turned out that a lot of them relied on their networks and a lot of the knowledge was tribal. When conducting the user interviews, we asked them how much time they spend on data discovery and in the end found that customers spend around 40% of their time on various activities connected to data discovery, such as searching for a data set, trying to understand its schema and usage and finally searching for the owner to request access. That 40% became the baseline that we set out to reduce.
The main problem of this approach is that people are not good at estimating how much time they spend on creative and exploratory tasks that are open-ended. In the case of data discovery, running subsequent surveys yielded results that varied more than seemed logically possible. For example, some questionnaires resulted in a three to fourfold decrease compared to the baseline 40%. Attaching value to the catalog using just this one percentage became impossible, even somewhat reductive. We realized that it would be far better to identify specific pain points in the baseline process model and start optimizing those.
As a course correction, we realized we had to model all the stages users go through during their journey from data discovery to value extraction. The process was split into three phases: ‘search and discrimination,’ ‘request access to data’ and ‘validate with exploration.’
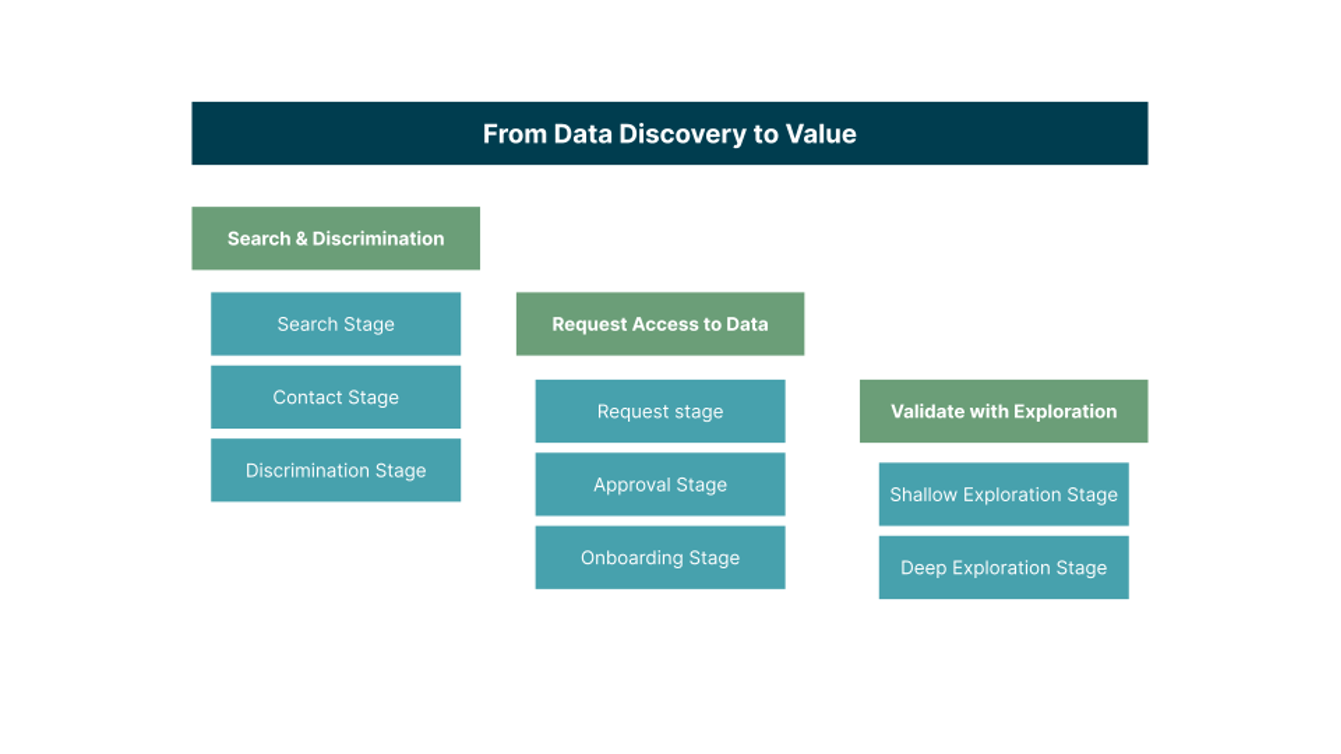
Each of the phases contains actions that bring value to the user: when a user requests access to data and that request is approved, for example, they are then able to begin exploring the data. These actions represent leads that allow us to measure how much time it takes for the user to reach that point in the process. Leads are measured within the catalog by generating an event every time a user performs an action within the tool. We can assign monetary value to those leads based on the cost of development time and use them as a proxy to measure the value the catalog brings. Additionally, contrasting the time it takes for a user to perform actions within the catalog to the data from user interviews we did meant the team was able to estimate that the catalog saves its users, on average, two days on data discovery.
Both of the approaches Adevinta took, solely relying on user interviews and calculating how much time people spend to reach certain points in the process, aim to estimate how much effort people spend on data discovery. In the end, we needed to come up with a process model for the whole user journey and focus on pain points within it. It allowed us to identify value-adding steps and assign a quantified monetary amount to them. This practice has allowed us to articulate and communicate the value of the catalog in a much more granular way; in turn, it also gave us a framework for future optimizations.
Disclaimer: The statements and opinions expressed in this article are those of the author(s) and do not necessarily reflect the positions of Thoughtworks.