


Agile analytics is all about failing fast. In a scientific context, this means stating hypotheses and seeking to disprove them using quantitative analysis of real data in rapid cycles. The end result is actionable insight and maximized value to stakeholders. This article is the second in a series where we paint a picture of a Thoughtworks analytics engagement. We'll focus here on the deployment of solutions in production, where insights reached in the Data Lab are implemented at scale.
A Picture of an Agile Analytics Engagement
In our recent article on the data lab, we painted a picture of how an agile analytics engagement might unfold. The following chart illustrates our thinking.

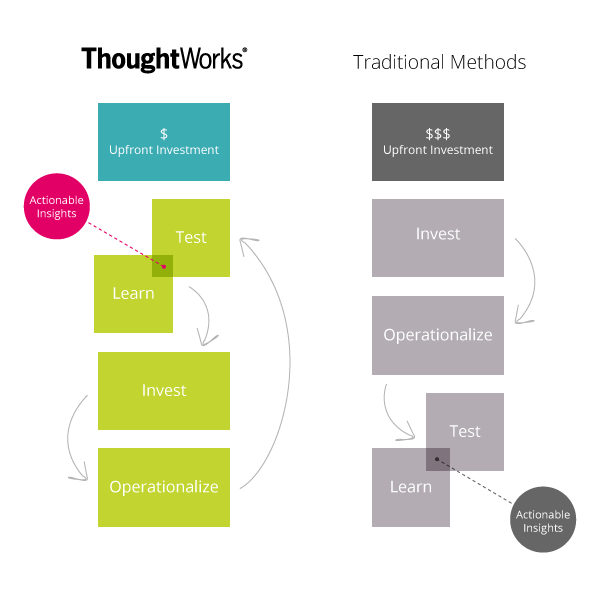
The up-front, short-cycle explorations in the data lab allow the data science team to understand the nature and quality of the data, form and refine business questions, and select the right statistical tools to answer those questions. The prototypes and proofs-of-concept developed in the data lab are then deployed into production.
Operationalizing Solutions
Operationalizing solutions takes special care because tools used in the data lab to are often distinct from those used to crunch data at scale, in production. Whereas relatively few lines of R or Python are needed to choose whether to use singular value decomposition or k-means for a recommendation engine, Hadoop MapReduce and Storm may be needed to apply these methods to high volume, high velocity user product preference events as they arrive from a web site, in real time. The process of implementing a scalable solution should begin as soon as a viable method is discovered in the data science lab. This is the cycle of Invest and Operationalize in the above picture.
It's important to underscore that not all analytics engagements involve Big Data. MapReduce on a Hadoop cluster is best applied to a relatively narrow set of problems, such as indexing the internet, and is not a catch-all, black-box solution to all advanced analytics problems. (We'll cover the appropriateness of Hadoop in an upcoming article.)
Implementing solutions at scale is costly. By testing techniques, characterizing data sets using well selected subsets, and honing business questions up front in the data lab, we mitigate the risk of operationalizing solutions that turn out to be garbage. We leverage the strengths of statistical data analysis tools that scientists and statisticians typically use for rapid insight, and only proceed with an approach that is known to work.
The principle also applies to database choices, which should leverage the unique, intrinsic traits of data sets. While the scale of production data might disallow a particular schema or database technology, chunking that into data sets in the data lab allows us to apply tools best suited to the nature of the data. If the data involves key-value pairs, then we have the choice of Redis. If the data is largely graph connections, we can consider graph databases like DEX or Neo4j. Managing the data set in the right container allows for the analytics engine to worry less about the data structure and more about utilising the data set in a fashion closest to the nature of the data. This is polyglot persistence in practice, and the result is minimized cost.
Data-driven Development
The principles of test-driven development should be applied to advanced analytics solution because we’re still developing software. This ensures that even though our code might be used to reject a hypothesis, its behaviour is deterministic & well tested as we shouldn’t be incorrectly rejecting a hypothesis. But data analytics brings some new concepts to the table, particularly due to the non-deterministic nature of applying statistical analysis (though technique itself is deterministic).
Real data carries with it an element of randomness, but there are still ways to test whether code is free of bias/assumptions to within specifications. Mathematical methods in code should output known answers to sufficient numerical precision over the full range of inputs. Input data should be verified to possess the same quality as that used in the data lab. Metrics should be statistically unbiased. Verifying precision and accuracy very often involves generating mock data sets that resemble the real data but have known input parameters, and tests in production entail recovering those known parameters by sending the mock data through the pipeline. Without data-driven tests like these, the validity of data analytics are inordinately difficult to ascertain, increasing the potential for projects to fail.
As Always...Don't Do Agile, Be Agile
The picture we've painted in our series on Agile Analytics lets us frame how an engagement with Thoughtworks might unfold, but it is not a prescription. At the heart of it, however, is that agile analytics is all about rapid feedback. It’s about stating hypotheses, ensuring they are answerable, understanding available data, refraining from operationalizing until you've arrived at a proven approach on a small scale, and always validating chosen methods and software.
This article was co-authored by Anand
Learn more about our Big Data Analytics approach.
Disclaimer: The statements and opinions expressed in this article are those of the author(s) and do not necessarily reflect the positions of Thoughtworks.