
APIs
Opentracing and Jaeger (part two)

Distributed systems have a far higher number of interconnected parts, so the number and types of failure that can occur are higher too. Additionally, distributed systems are constantly updated; every change can create a new type of failure.
Is there any method that we can use to observe what is happening in this system? Or what has happened to a specific request?
Without a methodology, the system will be chaotic. Fortunately, we have cybernetics.
According to the CNCF (Cloud Native Computing Foundation) official doc, the definition of observability comes from Cybernetic.
The core concept of cybernetics is circular causality or feedback—where the observed outcomes of actions are taken as inputs for further action in ways that support the pursuit and maintenance (or disruption) of particular conditions.
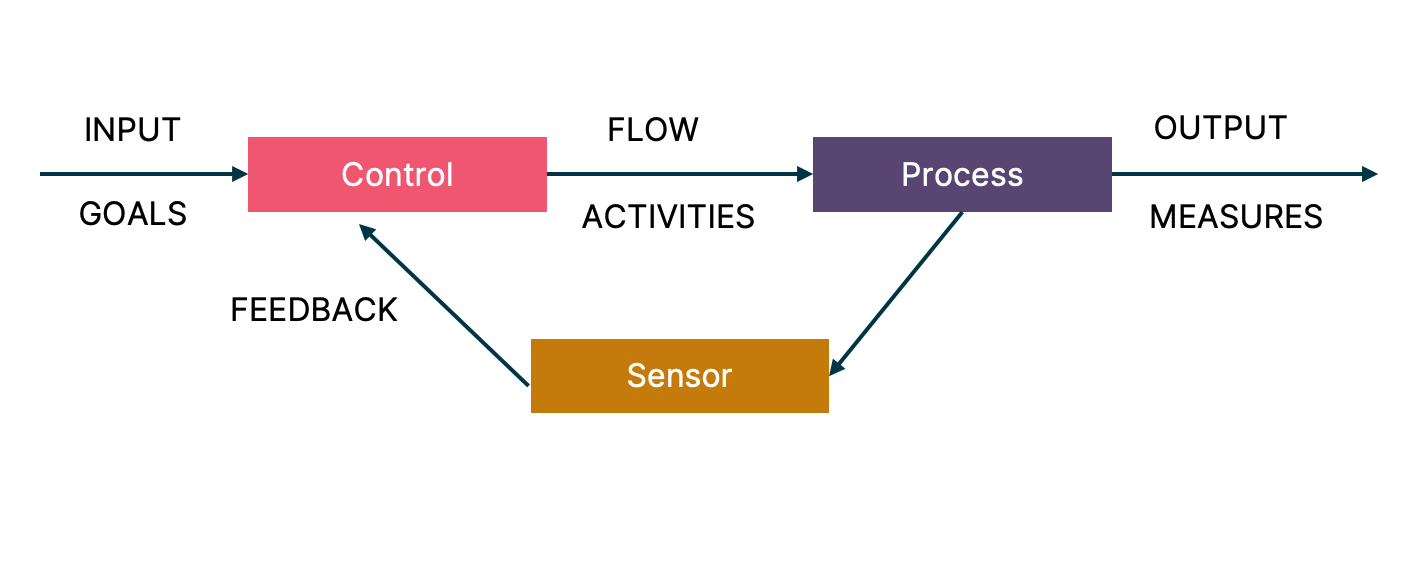
Conception of cybernetics
Observability is the ability to measure the internal state of a system only by its external outputs.
For a distributed system like microservices, these external outputs are known as telemetry data. It includes information like the resource consumption of a machine, the logs generated by the applications running on a machine, and more.
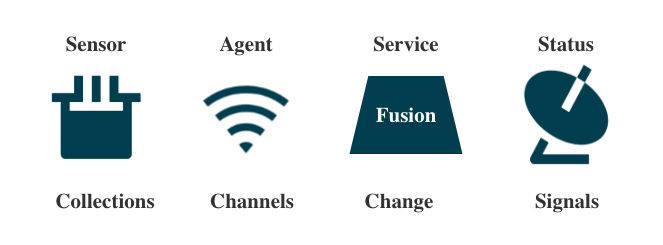
With a more detailed definition, observability can be divided into four parts:
Sensor: Lying inside every microservice, it collects all events and sends them to the agent.
Agents: There is a sidecar component with every microservice. It receives all events collected by the sensor, and does some regulation work. Then, it sends all the collected info to the Service.
Service: Its duty is like a Fusion, it reconstructs the collection, and classifies it into different dimensions.
Status: After the reconstruction and classification of the collection, we can easily define and observe the system’s status.
Observability is divided into three major verticals — metrics, logs, and distributed traces — the so-called three pillars of observability.
Log: An event log consists of context and a timestamp. Event logs can exist in binary, structured, or plain text form, but the general purpose of any event log is to make a record of a certain activity.
Metric: Metrics are numbers that help summarize behavior and performance over time, giving you much-needed insight into your systems. With the right metrics, you should be able to establish benchmarks of "normal" operation and set standards for future performance.
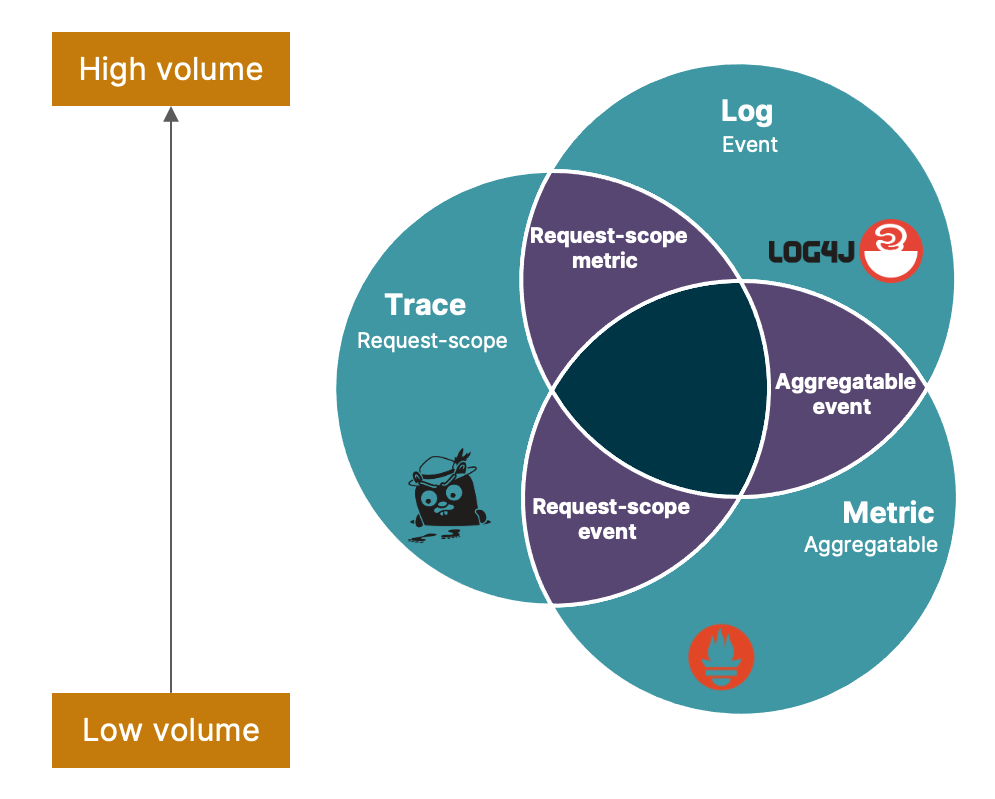
Metrics and logs can help reveal behavior and performance of a given application or system, but they are not able to detail the complex journey of a request as it crosses through all of your systems.
With the information that a trace provides, software engineers are able to better understand all the complex triggers of a given problem.
Standards of tracing technology
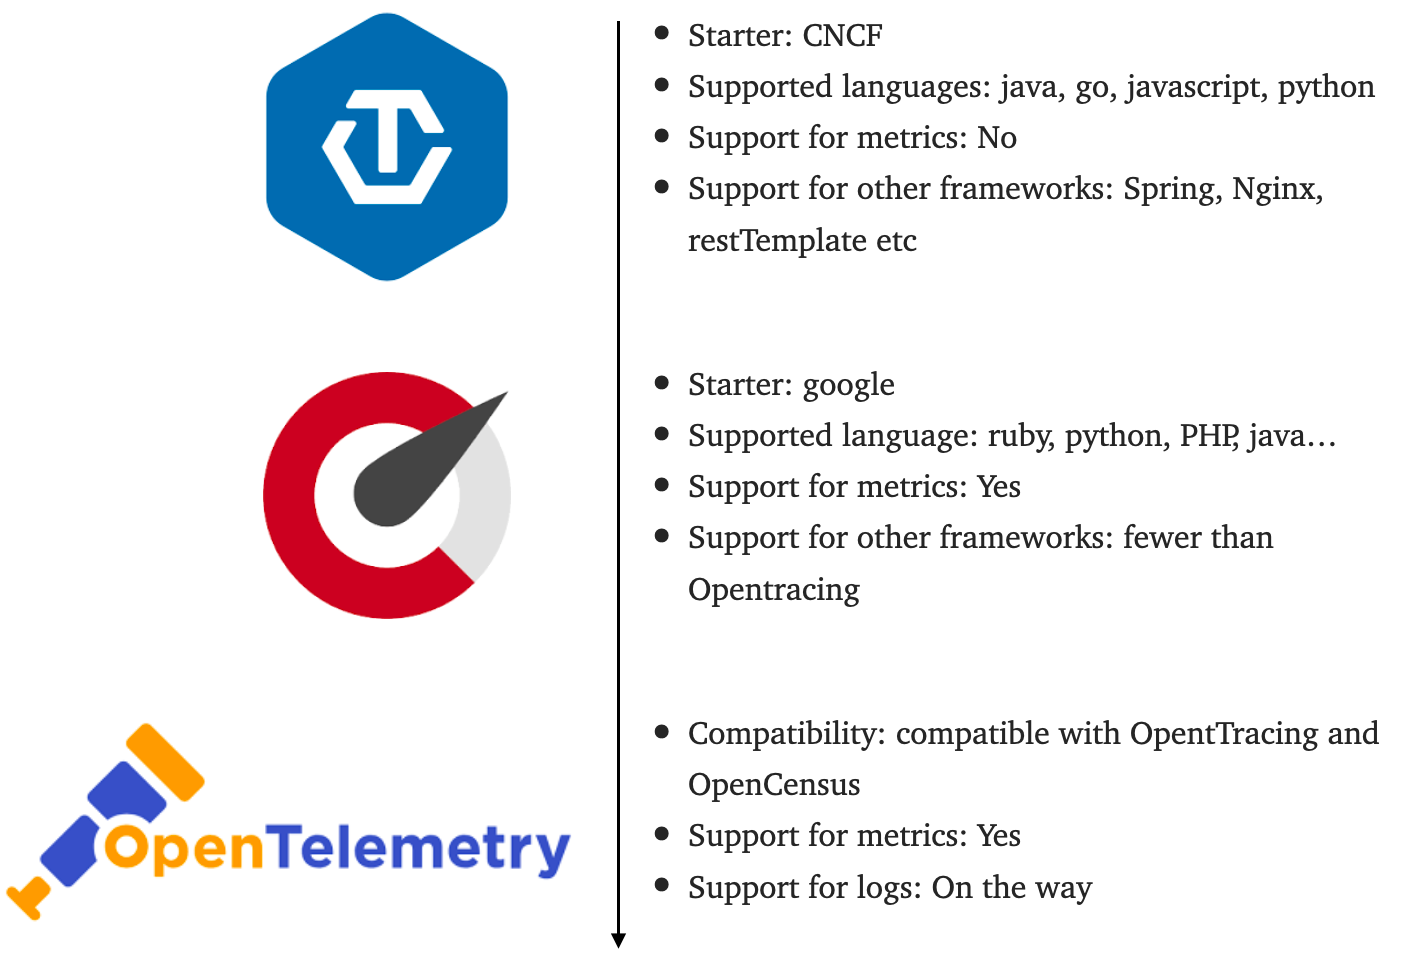
Just like with log metrics, there are also many different standards and implementations of tracing. There are currently three widely-used standards: opentracing, opencensus and opentelemetry.
Opentracing: The most widely used standard is Opentracing, started by CNCF. It supports plenty of programming languages. Meanwhile, it has already integrated with many widely used frameworks like spring, nginx and resttemplate.
Opencensus: Started by Google, it supports both tracing and metrics data. But compared with opentracing, it supports fewer frameworks and programming languages.
Opentelemetry: It not only combines pros of both opentracing and opencensus, but also avoids their cons. But, it is an ongoing standard, which means it is not mature enough to be implemented.
OpenTracing is an open-source project that aims to provide vendor-neutral APIs and instrumentation for distributed tracing. In distributed cloud-native applications, it is difficult for engineering teams to see how requests are performing across services. And that’s where distributed tracing comes into the picture.
But the problem for large organizations in adopting distributed tracing is the lack of reusable instrumentation for a vast number of open-source frameworks and libraries.
OpenTracing terminologies are meant to solve this by developing a common instrumentation API.
There are four main terminologies in Opentracing:
1. Trace and Span
Trace: The description of a transaction as it moves through a distributed system.
Span: A named, timed operation representing a piece of the workflow. Spans accept key:value tags as well as fine-grained, timestamped, structured logs attached to the particular span instance.
2. Tags and Logs in Span
Tags are key:value pairs that enable user-defined annotation of spans in order to query, filter, and comprehend trace data. Span tags should be applied to the whole span. There is a list of conventional span tags for common scenarios available at semantic_conventions.md. Examples may include tag keys like db.instance to identify a database host, http.status_code to represent the HTTP response code, or error which can be set to True if the operation represented by the Span fails.
Logs are key:value pairs that are useful for capturing timed log messages and other debugging or informational output from the application itself. Logs may be useful for documenting a specific moment or event within the span (in contrast to tags which apply to the span regardless of time).
3. SpanContex
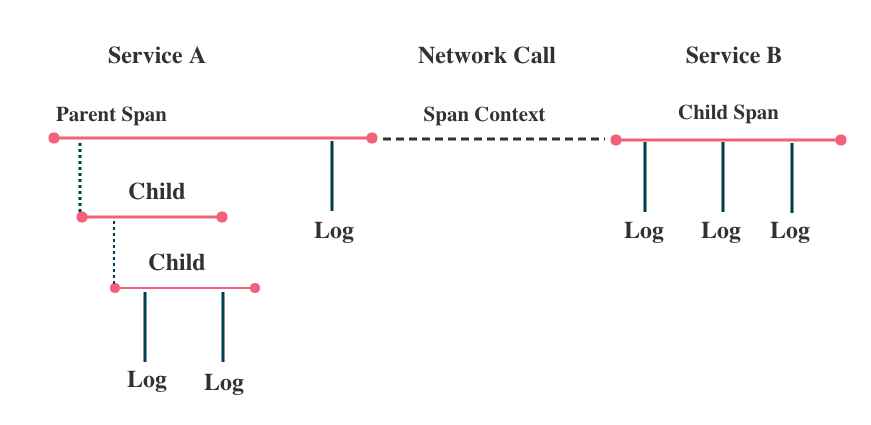
The SpanContext carries data across process boundaries. It has two major components:
An implementation-dependent state that refers to the distinct span within a trace. i.e., the implementing Tracer’s definition traceID
4. Span reference
A Span may refer to zero or more other SpanContexts that are causally related. OpenTracing presently defines two types of references: ChildOf and FollowsFrom. Both reference types specifically model direct causal relationships between a child Span and a parent Span. In the future, OpenTracing may also support reference types for Spans with non-causal relationships (e.g., Spans that are batched together, Spans that are stuck in the same queue, etc).
ChildOf references: A Span may be the ChildOf a parent Span. In a ChildOf reference, the parent Span depends on the child Span in some capacity.
FollowsFrom: FollowsFrom is used in special cases where the new Span is independent of the parent Span, such as in asynchronous processes.
In the next part, we’ll discuss how to use Jaeger to monitor microservices-based distributed systems.
Disclaimer: The statements and opinions expressed in this article are those of the author(s) and do not necessarily reflect the positions of Thoughtworks.