


Isn’t A/B testing just “40% is better than 30%”?
You have a product and want to encourage more people to complete a specific task. You have 2 ideas, you decide to A/B test them to see which is better. So, you put your users into two groups (A and B) where each group sees a different solution, and then measure which group is more successful at completing the task. After 200 total tests, 30 out of 100 people in Group A completed the task, while 40 out of 100 people in Group B completed the task.
The answer is obvious: B is better than A, right?
Not necessarily.
Why can’t I simply compare 40% with 30%?
Let’s take a look at group A. In this group, you observe 30 successful outcomes. However, it is just one observed number. If you run the experiment again, you may see 35 or 22. If you do it many times, the number of successful outcomes follows the Normal Distribution curve.

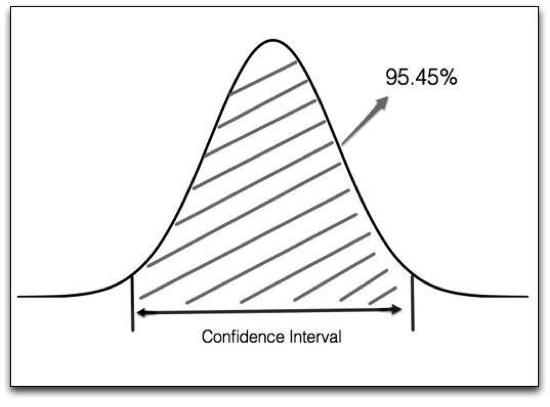
See the shadowed part of the image above? 95.45% of the possibilities fall into an interval, which statisticians call the Confidence Interval. For our example, we can get the confidence interval for each group using a standard formula.
Group A: [21%, 39%]
Group B: [30%, 50%]
What does this mean? It means that although you observed 30% for group A, and 40% for group B, the possible result is [21% ~ 39%] for A and [30% ~ 50%] for B. Do you still think group B is definitely better than A?
Maybe not.
What should I do then?
Now you see it’s not simply about comparing two numbers, but comparing two intervals. At a certain point the two number intervals become far enough apart to be able to tell that one is better than the other. The fancy word statisticians use for this is Statistical Significance. They use a concept called p-value to measure it.
P-value is the possibility that your observed result is MISLEADING you. In our case, the p-value is the possibility that Group B is not better than Group A. The lower the p-value is, the higher is the confidence about your assumption. A classic inverse relationship :)
Let’s look at these pictures:

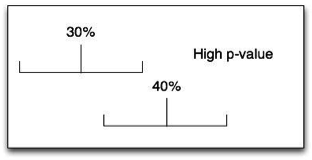

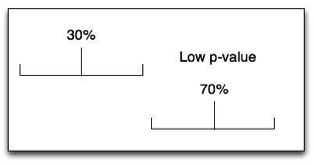

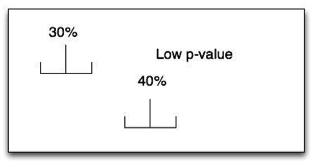
From the examples, you can see that the farther apart the two observed numbers are, the smaller the confidence intervals are, and the lower the p-value is.
In practice, we suggest aiming for a p-value < 0.05 to make your A/B testing decision. You can balance your desired statistical significance vs. the cost of A/B testing based on your own situation.
Check out Part II to learn how to apply this in practice with a step-by-step A/B testing example.
Disclaimer: The statements and opinions expressed in this article are those of the author(s) and do not necessarily reflect the positions of Thoughtworks.