


Transitions of any kind usually imply a long and nebulous journey, so it’s unsurprising that before too long, questions come up around how teams can best measure their progress. These are not unreasonable questions, and a large number of different tools and maturity models claim to help find the answer. But experience tells us that achieving a level of maturity, according to one or more models, does not mean that you are now competing more effectively in your market, or that you will become an employer of choice. It’s actually much more complicated than that.
One approach we have found particularly useful has been the Agile Fluency Model, developed by Diana Larsen and James Shore in 2012 and the subject of many excellent articles and talks published since then. At Thoughtworks, we have used the Agile Fluency model as a framework to help teams understand their current position and to help them develop an individual road map. This article will cover how the model works in general, how and why it is preferred to other available models and key lessons learned from our experience. It is hoped that others will build on our experiences and use the model in teams other than software and share the resulting knowledge with the community at large.
What is Agile Fluency?
The Agile Fluency model does not measure your team or your organization's fluency against a set of arbitrary goals, other teams, other organizations or any official standard. The Agile Fluency model helps teams to understand where they are in terms of their own goals, and understand what is relevant for their particular context and needs. It is more like a pattern (a solution for a context) than something like Capability Maturity Model Integration (CMMI). The Agile Fluency model does not assume that all teams will start at level 1 and then work their way up to level 4. On the contrary, a key aspect of the model is identifying what level of fluency makes sense for you, your team and your organization. It is even possible for teams to go backwards deliberately, if a lower level of fluency makes sense for your context.What is Fluency?
Fluency is defined as:
the quality or condition of being fluent, in particular:
synony fluidity, flow, smoothness, effortlessness, ease,
ms: naturalness;
grace,gracefulness, elegance;
regularity, rhythm, rhythmicity;
rareflowingness
"his walk had a feline kind of fluency to it"
The Oxford Dictionary

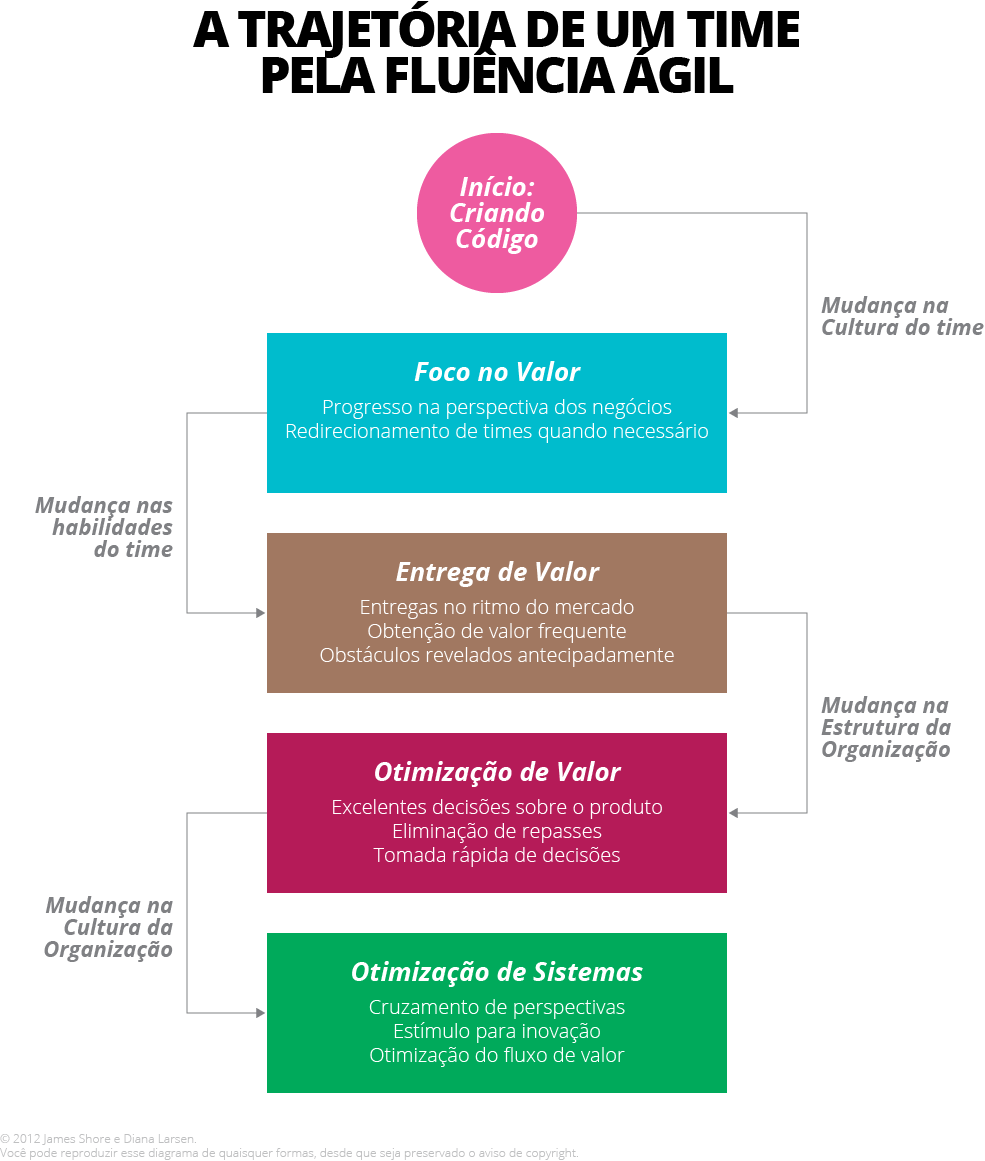
The model offers four levels of Agile Fluency from 1-star fluency through to 4-star fluency. Star 1 is about fundamentals and is experienced through both a team and organizational culture shift and through the adoption of certain practices. Key amongst this is the practice of transparency; a team and an organization working at this level shares information within the team, with other teams and more broadly with the organization. Culturally, teams at this level understand what they do, provide value to the organization, actively seek to improve their practices and develop both internal and external relationships in support of this goal. The core metric for level 1 Agile Fluency are positive answers to:
- Does your team plan and work on delivering value?
- Can anyone in your organization see progress?
- Is this happening as the norm?
- Does the team know the right delivery cadence for the market or business?
- Does the team have the skills to deliver value and quality consistently?
- Are the business and the team using a shared language to talk about goals and progress?
- Does the team have access to all the business information they need to deliver high value products?
- Is the team empowered to make product decisions?
In order to put all of this in context, it’s useful to look at some examples. For instance, 1-star Agile Fluency might be appropriate in larger, more traditional organizations, such as those in the financial and government sectors, or where there are significant regulatory requirements to be met. 2-star fluency might be right for web based organizations such as Amazon; 3-star fluency might be needed for ‘software as a service’ companies such as Netflix, whereas 4 star fluency is seen mostly in start-ups. Interestingly, a start-up might find 4-star fluency appropriate in it’s early days, but as the company grows larger, 3 start fluency might be what they really need.
Latest Thinking
An alternative perspective on the fluency levels, particularly the use of the star system, is that the stars represent the amount of investment an organization will need to make. The more the stars, the bigger the investment. Investment in this sense is about taking the time and spending the money to start thinking about teams, rather than individual contributions, allowing flexibility in work processes as teams experiment, and understanding the need to slow down in order to learn and speed up. There needs to be investment in training and coaching, but in the areas teams want to target, as well as investment in peer mentoring. As always, a business champion, someone willing to spend their social capital in the organization, is requisite.Case Study – Using the Agile Fluency Model
Whilst there are many potential uses for the model, I would like to share one of our recent experiences with it. Hopefully this will provide you with some ideas or a starting point from which new approaches can be developed.Context
We were working with a particular delivery group within an organization. The goal of the group was to transition away from delivery approach centered on large releases, towards a Continuous Delivery environment. Over the preceding months, the group members had made many other changes to their practices, including creating several cross-functional delivery teams. Previously, they had worked as non-permanent project teams, forming and disbanding according to the needs of particular projects.The group wanted to take the opportunity to review their progress and set goals for the months ahead. Each team had different strengths and different things the team members wanted to focus on, but at the same time, there appeared to be a number of common goals and interest areas.
We decided that the Agile Fluency model would provide a great framework for the exercise, as it took context into account and would allow teams to identify relevant practices to assess themselves against. We knew from working with the group that aiming for a 2 star fluency level made the most sense, based on the length of time they had been working together, their environment and the kinds of products they were delivering. We wanted to make the assessment exercise interesting and enjoyable to do and make it a practical team activity with visual outputs.
Data Collection
We decided to build upon some work that has already been done in this area, using the visual concept of the Thoughtworks Technology Radar to identify the kinds of practices you would expect to see in teams working at various levels of fluency.The fluency radar is made up of four concentric circles, the innermost representing a 1-star level of fluency, though to 4 stars on the outside. The radar is divided into four quadrants; practices, processes, concepts and enterprise. Within each quadrant, numbered blips represent the specific practices and ideas at each fluency level.

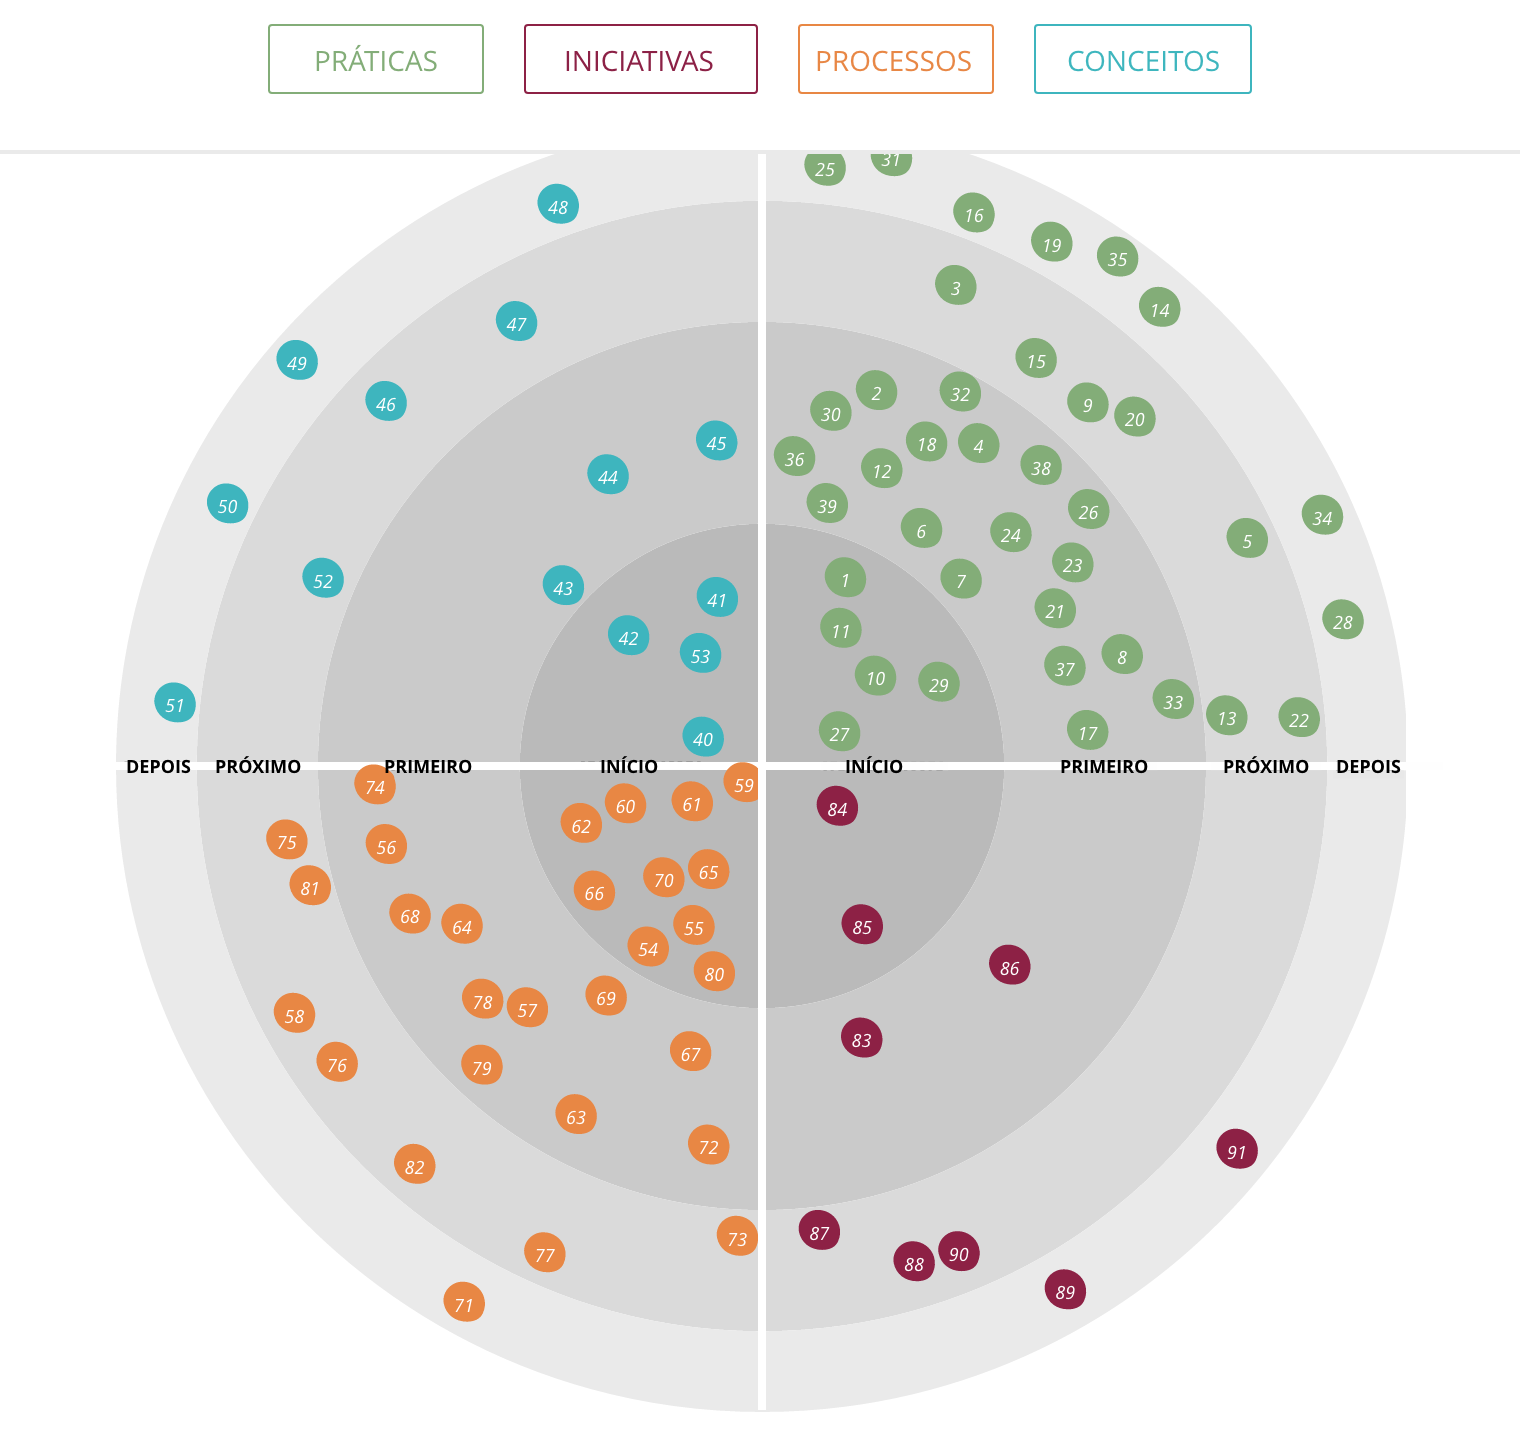
Whilst the radar itself is available on the web, we wanted the assessment process to be simple, tactile and to involve face-to-face discussion. So our approach was to print out each quadrant, and get each team together, away from their desks. We explained how the model worked and asked the team to work in groups of two or three. They discussed each practice in their quadrant, starting from the center of the radar and made an assessment, on behalf of the team, based on a traffic light system. Red indicated that the practice, process or concept was either not being done, was too difficult (blocked in some way) or not relevant; yellow indicated that the practice was being done, but was not yet at the level of fluency or comfort the team wanted, and green indicated that the practice was being done and that the team felt that they were fluent with it. We also asked teams to indicate where they felt they were unable to answer for the team without further discussion.
Data Analysis
Given our lo-fi approach to data collection, getting the collected data into shape for analysis involved a lot of typing into a spreadsheet, (this represents a big improvement opportunity). For an individual team, this wouldn’t be an issue, you can just look at the traffic light colored radar you have produced. However, we wanted to look for common focus areas as well as identify teams with strengths that corresponded to weaknesses of other teams. We tried a few different visualization tools, including Excel, Google Sheets and Tableau, and a couple of web based tools, such as Raw. In the end, radar charts, produced in Excel, provided the best results. We could generate these for a single team (for road map development), multiple teams (to identify opportunities for group development) and for pairs of teams (to identify the best match for knowledge sharing).
Results
We were able to draw the following general conclusions from the data:- Most of our teams felt they were sufficiently fluent at 1 across most practices - lots of greens, a few yellows and very few reds
- There were a few more yellows at level 2 and we were able to identify several opportunities for group development activities
- There were a number of greens and yellows at levels 3 and 4
- Being able to identify which teams had strengths in particular areas was valuable
Next Steps
Having collected and analyzed the data, the next step was to make sure that our teams got the maximum value out of the process.We shared the data back to the teams along with some ideas on how they could use it, including:
- Identifying which other team(s) has the greatest level of fluency in specific areas and asking them to put together brown bag sessions or run workshops for other teams
- Identifying another team with strengths in a particular area and agreeing to pair on the topic
- Suggesting internal or external speakers on topics of broader interest
- Working with each team to develop and showcase their own roadmap
- Asking management teams for support where progress on a particular area is blocked by bigger picture challenges
- Agreeing to re-run the exercise at regular intervals, so that teams can assess their progress and refocus their attention if needed
A Retrospective
What went well
- The lo-fi process of having the teams work through the analysis was effective and enjoyable - it stimulated good open conversations and people enjoyed the experience
- Using the radar to generate the assessment for teams to use worked well - it was simple to use and generated an immediate and relevant visual output
- The data provided an overall snapshot of the group's strengths and weaknesses - that meant we could identify and target the one thing which would make the most difference
What could be done differently?
- A simpler spreadsheet to collect the data, (than the one we used initially) would have been adequate.
- Our approach this time was to use a common set of practices across all our teams. It would have been interesting to ask each team to nominate the practices that they felt characterized the different fluency levels for them
- An easier way to enter/collect the data would have been helpful. This was quite time consuming
Opportunities for Further Development
It would be useful to try digitizing the process to support quicker collection and analysis. However, it would be important to try to maintain the benefits of a team sitting down together to have the discussion. The model has a great deal of potential for use in different contexts, including at the governance level. Used in this way, it could be a clear indicator of the size of the investment an organization needs to make in order to achieve its perceived goals.So how can you use the model?
Step 1. Work out what fluency level makes sense for your team or organization.Step 2. Create your own radar equivalent with quadrants and blips that makes sense for you
Step 3. Run the exercise together
Step 4. Share the data
Step 5. Improve the model we have provided and share it back to the community
One way to think about this is that a higher fluency level represents an investment in your people. Each level has different costs and different pay offs. You may want to think about this in terms of what is the best you can get, for the amount of investment you can afford.
Resources:
http://martinfowler.com/articles/agileFluency.htmlhttp://www.agilefluency.org/
http://www.infoq.com/articles/agile-fluency-fit-purpose
http://www.infoq.com/news/2016/02/road-mapping-agile-fluency
Disclaimer: The statements and opinions expressed in this article are those of the author(s) and do not necessarily reflect the positions of Thoughtworks.