.jpg)
White paper
Five key trends shaping the future of payments and global money movement


Thoughtworks, Amazon Web Services (AWS) and NVIDIA
Fraud prevention has evolved significantly over the past two decades. Early models were largely rules-based, relying on static thresholds, velocity checks and manual review queues. These approaches were effective in a batch-processing world, where transactions could be paused and investigated before settlement.
As the adoption of digital payments accelerated, fraud models shifted toward machine learning, leveraging behavioral analytics, device fingerprinting, consortium data and sophisticated anomaly detection. Financial institutions invested heavily in predictive scoring engines capable of detecting unauthorized card fraud in milliseconds.
However, the rise of real-time payments has fundamentally changed the risk equation.
With instant payments, particularly with account-to-account (A2A) rails such as Faster Payments in the UK, UPI in India and Pix in Brazil, transactions are processed within seconds and are irrevocable. The resulting threat is defined as authorized push payment (APP) scams, where customers are tricked into initiating payments themselves. Unlike traditional card fraud, these transactions are technically “authorized,” making detection and reimbursement far more complex.
The financial impact is already significant and continues to grow. In the UK alone, APP fraud losses have exceeded £450 million annually, representing a substantial share of total payment fraud.
According to the ACI Worldwide Scamscope report, APP scam losses are projected to climb to $7.6 billion by 2028 across six leading real-time payment markets (the US, UK, India, Brazil, Australia and the UAE). Growing at a 17% CAGR, real-time payment scams are forecast to account for 80% of all APP scam value by that time.
If current exponential trends persist and real-time volumes continue to expand globally, cumulative APP scam losses over the next decade could easily exceed several hundred billion dollars, potentially approaching or surpassing $500 billion–$1 trillion cumulatively by 2035.
Fraud continues to be an ongoing concern for the card industry and e-commerce. As e-commerce spending accelerates toward an estimated $8.1 trillion by 2028, the opportunity for growth is being matched by increasingly coordinated fraud activity that exploits scale, speed and automation. For the payments sector, the long-term outlook remains fraught: cumulative global card fraud losses are projected to reach $403.9 billion over the next decade.
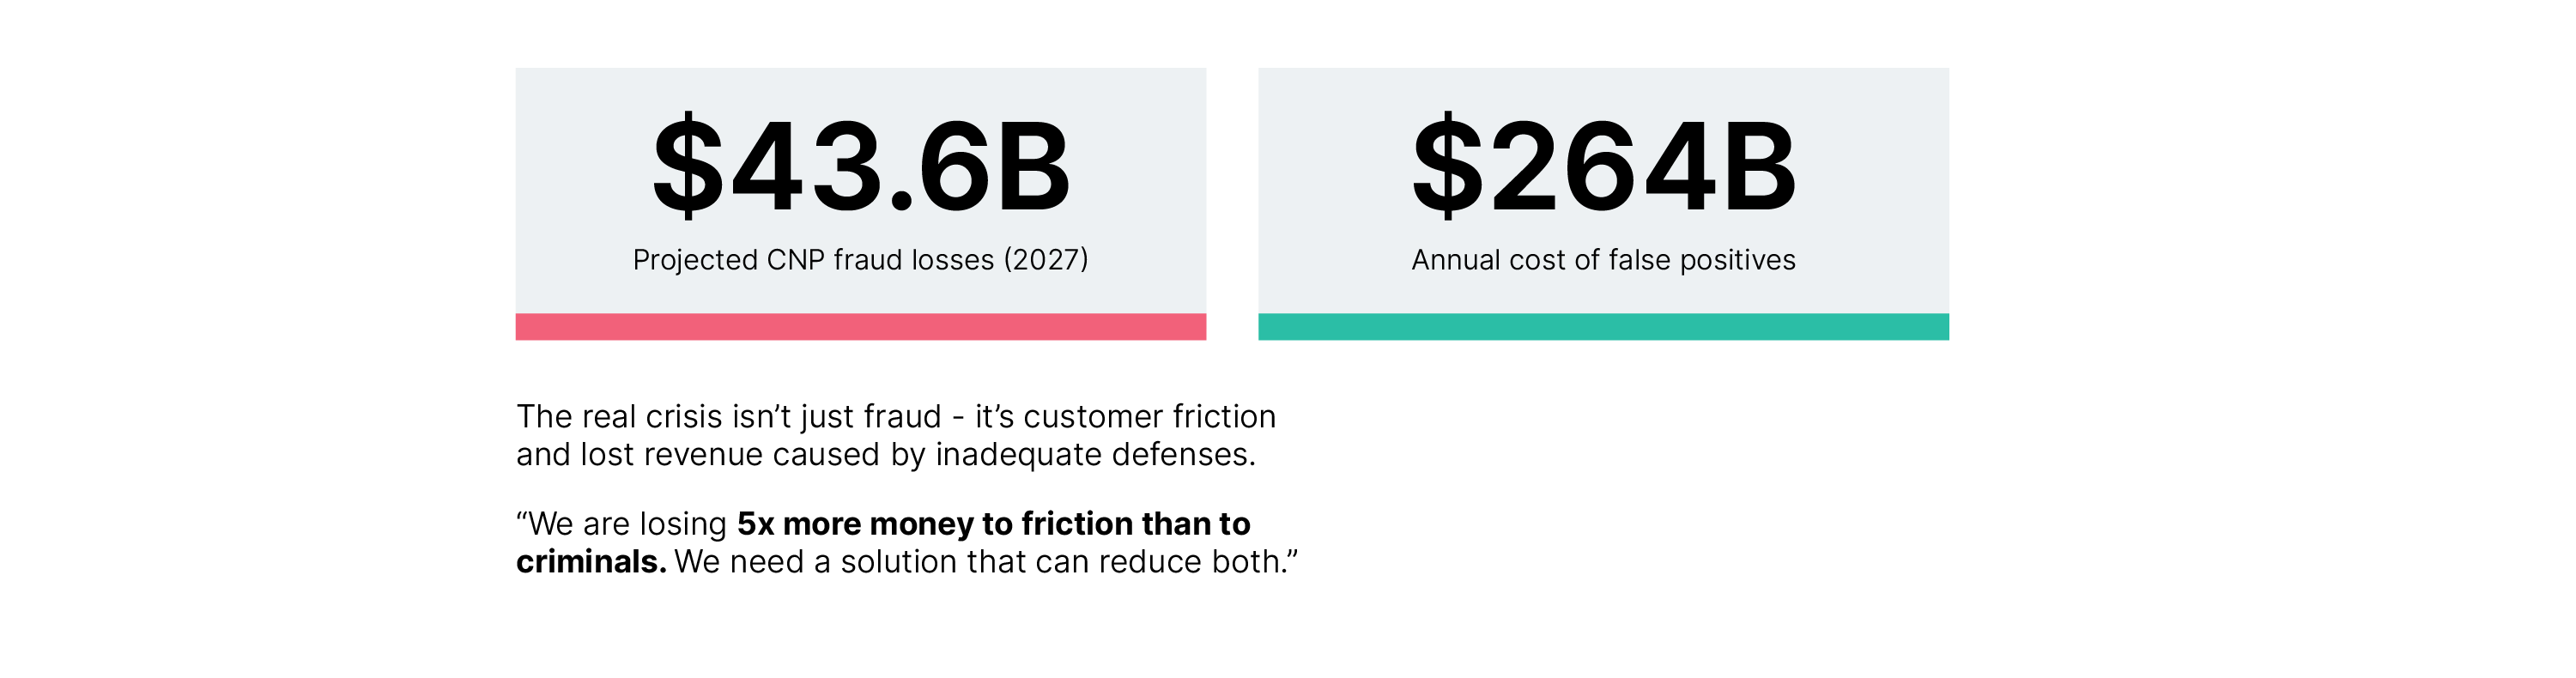
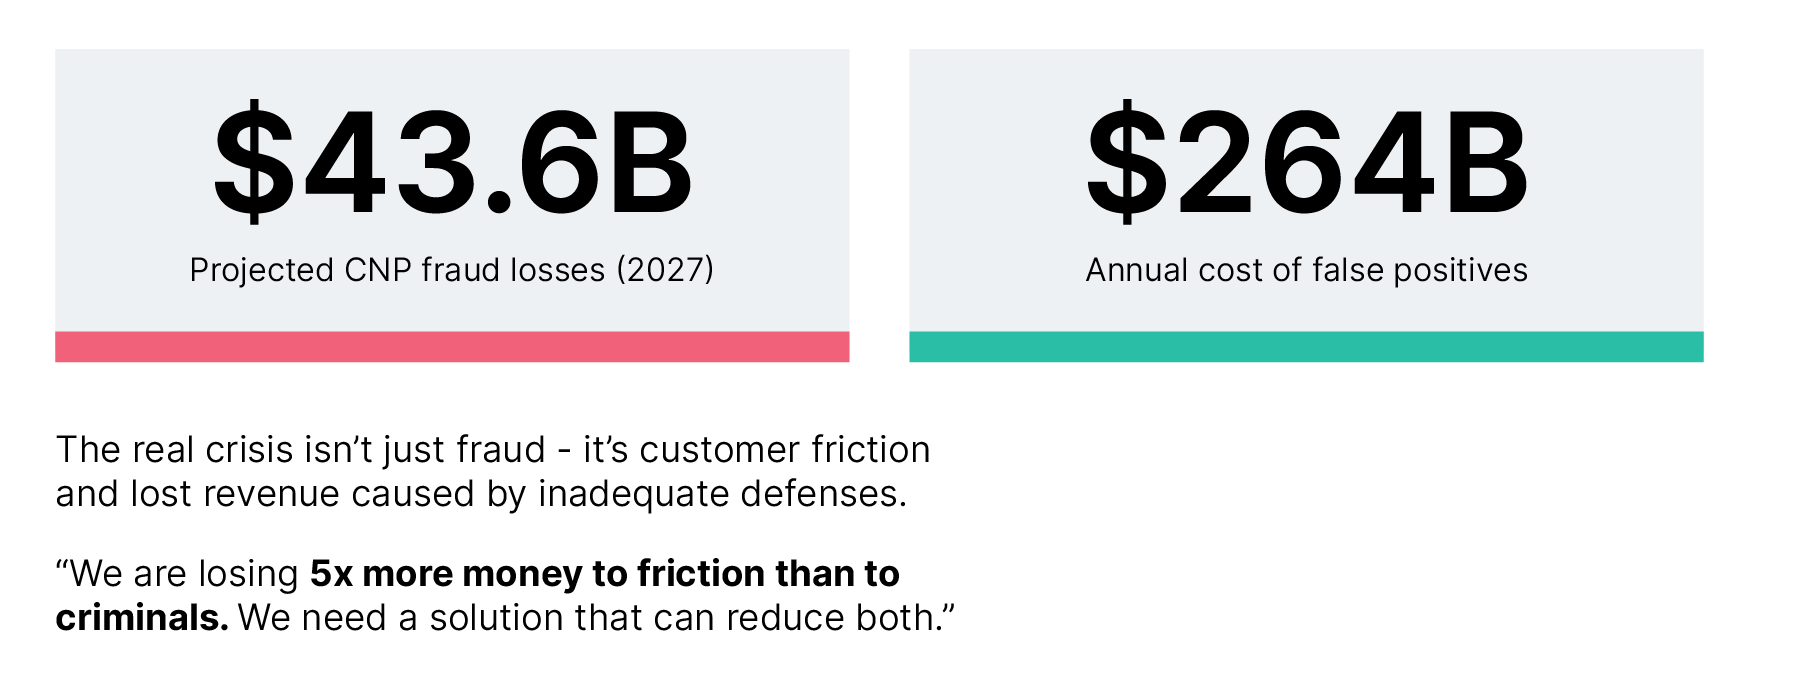
While the US accounts for approximately a quarter of global card spending, it endures a disproportionate 42% of global fraud losses. Within this landscape, Visa identifies card-not-present (CNP) transactions — the engine of digital shopping — as the primary target. According to the Merchant Risk Council’s 2024 Global Fraud report, global CNP fraud losses (unauthorized) are on track to reach $43.6 billion by 2027, underscoring an urgent systemic requirement for defenses that are as dynamic and globally distributed as the networks themselves.
However, the industry’s attempt to secure these rails with legacy, rules-based controls has created a secondary economic crisis: the “friction gap”. False declines are now costing businesses an estimated $264 billion annually. Crucially, revenue losses from these legitimate transactions are now nearly five times greater than direct fraud losses. The associated cost is permanent: 35% of shoppers will abandon a merchant entirely after a single false decline, and 25% of scam victims will leave their financial institution entirely.
At Thoughtworks, we believe the path forward requires more than just better models; it requires a new data paradigm. To protect growth without compromising security, financial institutions must move beyond row-based statistical models that cannot distinguish between sophisticated fraud rings and legitimate, high-velocity customers. Modern fraud is inherently relational, hiding in the connections between entities rather than individual transaction attributes.
We have actively embraced this shift, developing a robust proof of concept (PoC) for graph neural network (GNN)-powered fraud detection. This PoC has successfully demonstrated the capability of these methods to capture network-based fraud schemes.
Specifically, our model-building process has validated the ability of GNNs to:
Generate high-fidelity relational embeddings that capture complex, multi-hop risk signals.
Seamlessly integrate these embeddings as features into existing XGBoost classification systems.
Maintain real-time latency using efficient subgraph sampling for inference.
By moving from point-in-time detection to a holistic understanding of the financial ecosystem, GNNs allow for "surgical" precision in risk scoring. They identify the subtle topological patterns of money-mule networks and synthetic identities while simultaneously reducing the friction that erodes customer loyalty.
In a landscape where speed is a requirement and trust is the primary currency, relational intelligence is no longer an elective capability, but an operational necessity. We encourage clients to explore how Thoughtworks can rapidly integrate these GNN capabilities into their existing fraud prevention stack, moving from theoretical interest to quantifiable reductions in fraud losses and false declines.
Classical machine learning models form the bedrock of nearly every modern fraud detection platform. They are built on a straightforward and historically effective premise: analyze the characteristics of an individual transaction to determine if it is fraudulent.
However, fraudsters today are systematically exploiting this approach. Traditional models were built to catch individual actors committing clearly anomalous acts. Modern fraud, in contrast, is a networked enterprise. It is perpetrated by coordinated groups of actors who intentionally make their individual actions appear completely normal.
The complexity of modern threats — particularly APP scams and money mule networks — hides in the connections between entities rather than in the attributes of the entities themselves. The impact is widespread: more than three-quarters of financial institutions report an increase in APP scams. Similarly, 80% report a rise in "mule activity" on real-time rails. Because payments settle instantly, mules can move stolen funds across multiple accounts in seconds, "layering" the money before banks can react.
Traditional fraud detection systems are stymied by the networked nature of these crimes. As a result, the industry is looking for alternative approaches. This is the precise advantage of graph neural networks (GNNs). Because GNNs are designed specifically to operate on graph-structured data, they make it possible to analyze relationships and detect the coordinated groups driving today’s fraud.
Traditional machine learning models (such as XGBoost or Logistic Regression) excel at processing tabular data, where each row represents a discrete transaction. A core statistical assumption often underlying these approaches is that data points are independent and identically distributed.
In the context of modern fraud, this assumption breaks down. A money laundering scheme involves a chain of dependent transactions, while a synthetic identity ring relies on multiple accounts connected by a shared (often fabricated) address or device. By flattening this relational data into standard tables, traditional pipelines can inadvertently obscure the network topology that increasingly contains critical fraud signals.
This architectural constraint makes it particularly challenging to detect "collective anomalies." Tabular models are highly optimized to find "point anomalies" — discrete outliers such as a sudden, uncharacteristically large withdrawal. Modern fraud rings, however, often orchestrate collective anomalies: groups of transactions that appear perfectly legitimate in isolation but become statistically improbable when analyzed as a connected group. Sophisticated fraudsters actively exploit this by distributing their activity across multiple accounts, aiming to keep individual transactions below the risk thresholds of traditional row-based analysis.
To understand this gap, it helps to look at the specific risk indicators, or features, that different models prioritize. Traditional models rely heavily on attribute features (data describing the characteristics of a single event), making them highly effective at spotting individual behavioral deviations. In contrast, graph models are designed to process structural features (data describing the topology around the event).
Ultimately, while tabular models remain excellent at spotting discrete outliers (e.g., "This transaction amount is unusually high"), they are inherently less equipped to detect structural patterns (e.g., "These funds are moving in a circular pattern across seemingly unrelated accounts").
| Feature type | Tabular indicators | Graph indicators |
| Identity | Email age: Is the email address new? Device ID: Is this a new device? | Synthetic cluster: Does this device ID link to 50 other "different" users? Shared PII: Do these 10 accounts share a phone number but have different names? |
| Velocity | Transaction count: 5 transfers in 1 hour. Amount: Transfer > $10,000 (threshold breach). | Fan-out ratio: One account dispersing funds to 20 new accounts in <1 minute. Cycle detection: Money sent from A -> B -> C -> A (The "round tripping" washing technique). |
| Relationship | Beneficiary check: Is the receiver on a watchlist? Geo-distance: User IP is 500 miles from billing address. | Path length: Is the user two hops away from a known human trafficker? Community density: Is the user interacting with a tight-knit group of accounts that only transact with each other? |
The core innovation of GNNs is not just the algorithm, but the data representation. This shift in perspective is the key to reimagining risk.
Traditional view (relational table): A transaction is one row in a table. A user is an ID in a column. A device is another ID in another column. To find a connection, such as "which other users have used this device?", an analyst must perform JOIN operation. This relational database model is rigid. It obscures relationships and makes them difficult to query in real-time.
GNN view (graph): The entire financial ecosystem is modeled as a single, unified, dynamic network. In this view:
This graph structure is flexible, dynamic, and, most importantly, it natively represents relationships. The connection between a user and a device is not something to be "found" with a query; it is a physical part of the data structure. The fundamental premise is that this graph model is a far more accurate and high-fidelity representation of the real-world financial ecosystem. Instead of losing information by flattening data into tables, this approach preserves the rich, relational context from the very beginning.
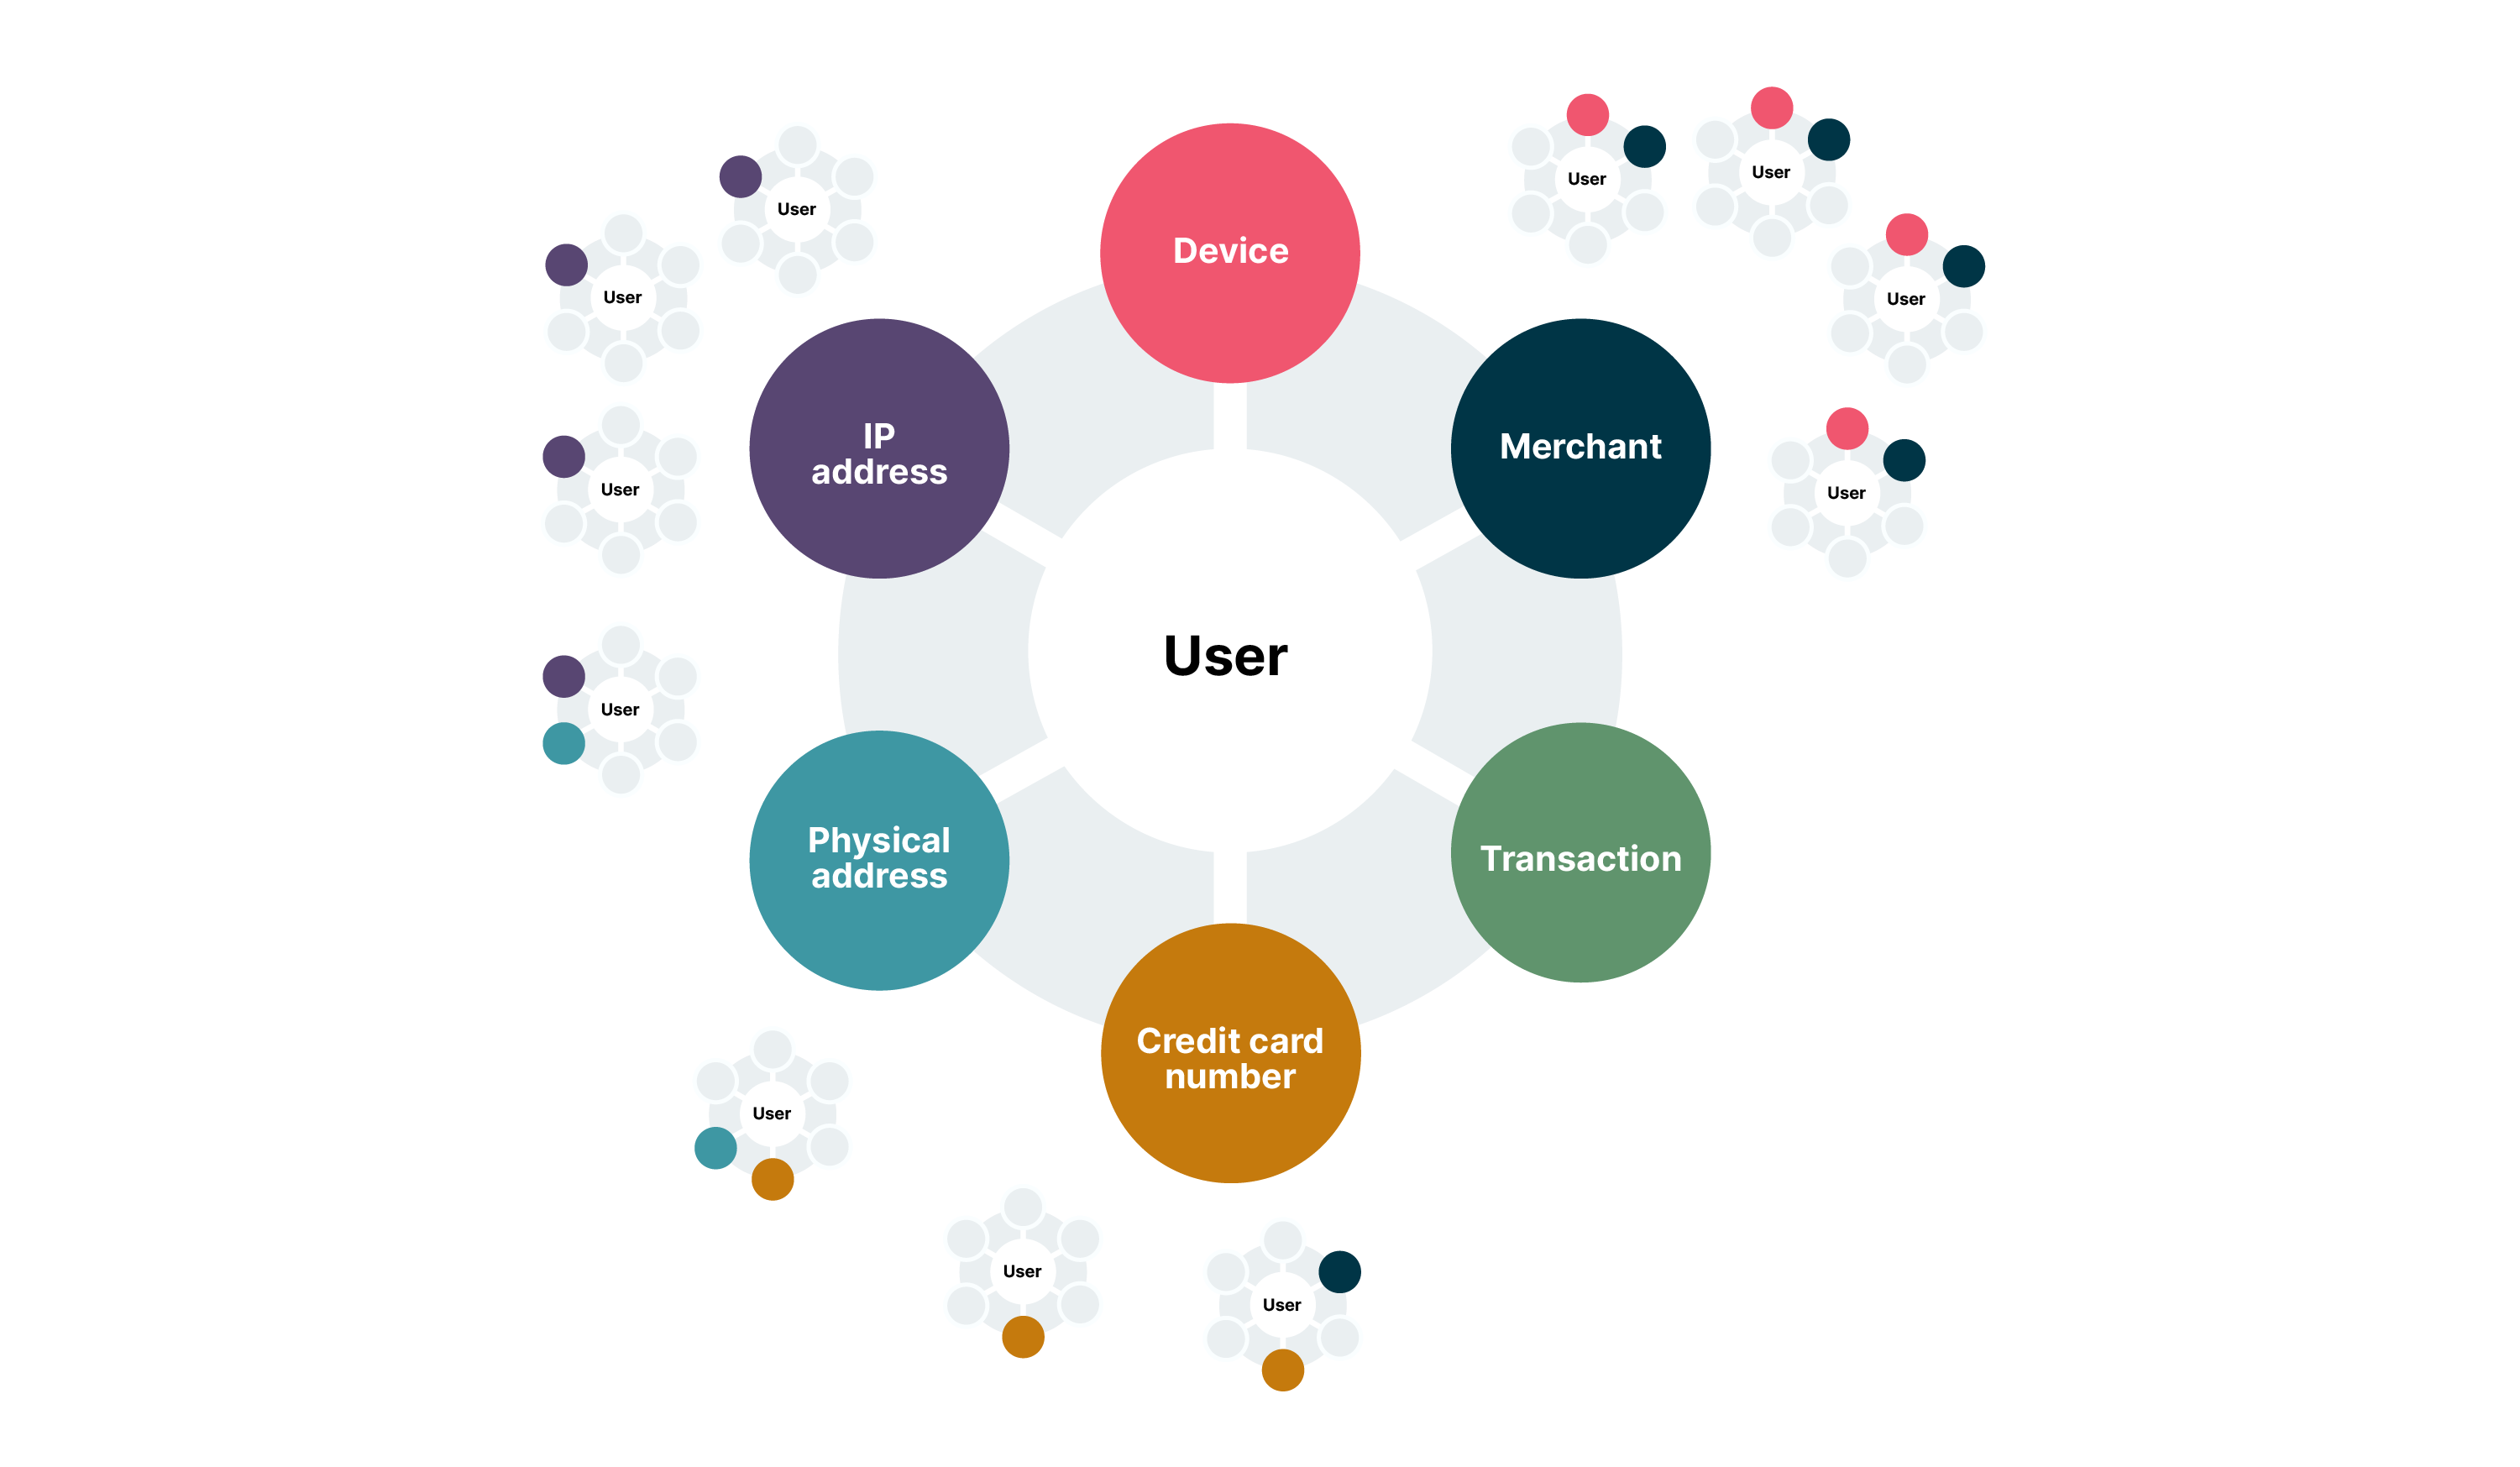
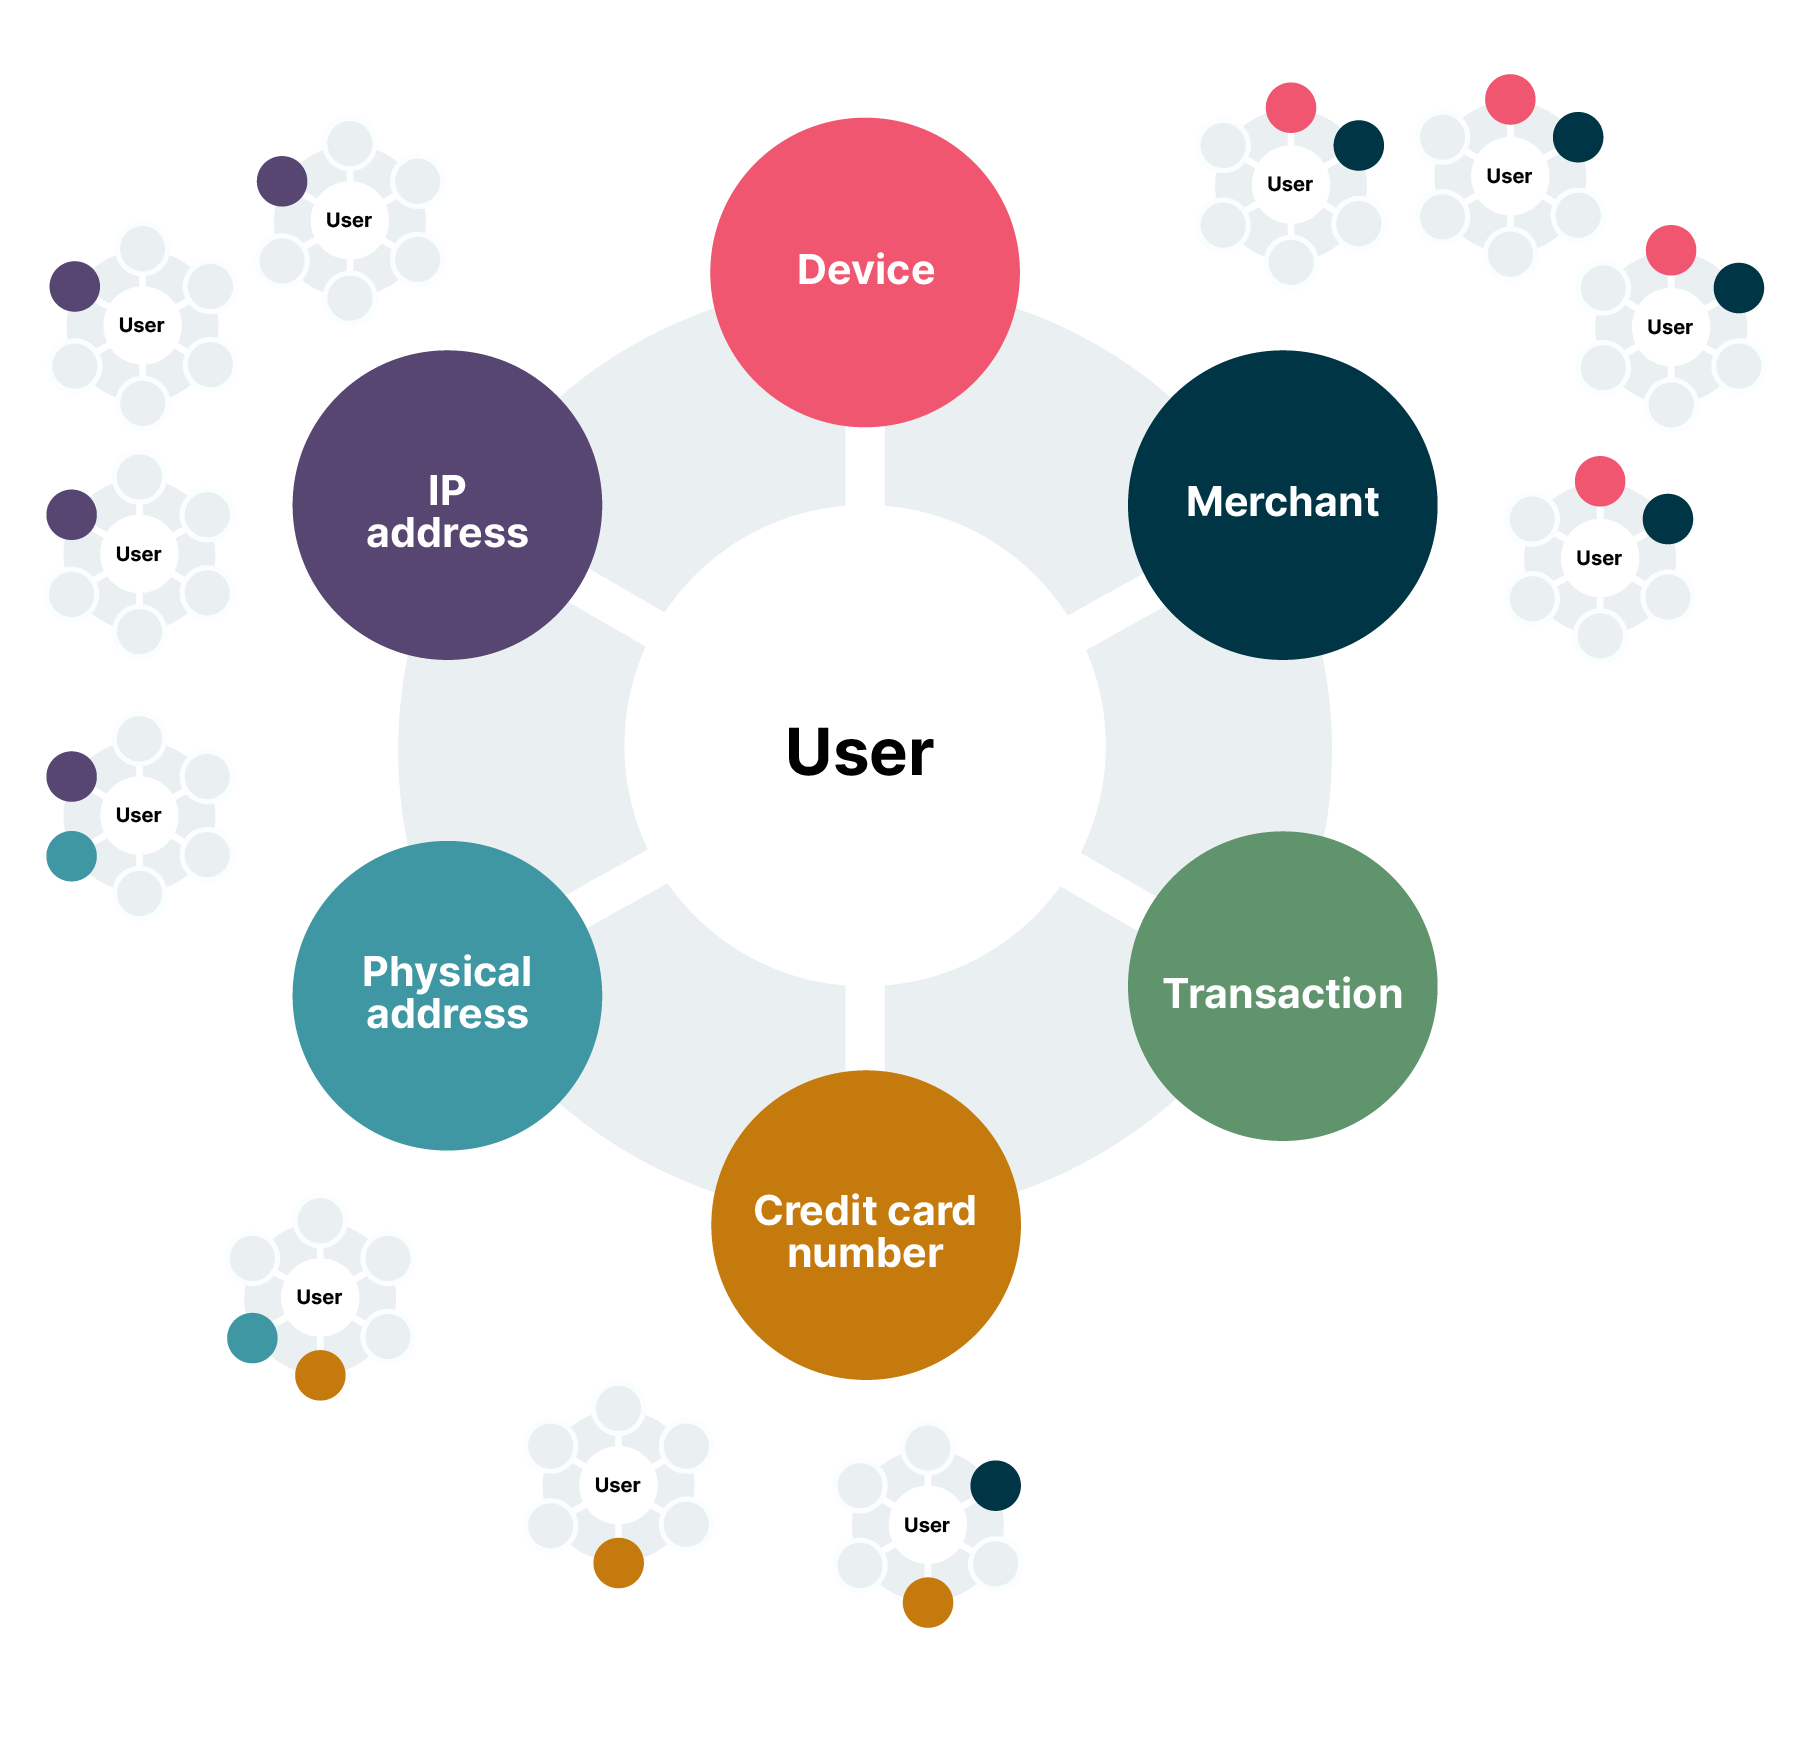
To apply GNNs, raw, tabular data must first be modeled as a graph. This graph consists of nodes (entities) and edges (relationships). An example graph would look like this:
Nodes (The entities): These are the "nouns" of the ecosystem. Instead of being mere attributes in a table, they become first-class citizens in the graph. Common node types include:
GNNs restore the context lost in tabular models. In a graph data structure:
Nodes represent entities (users, cards, devices, IPs, merchants).
Edges represent relationships (transacted with, logged in from, shared device).
The core mechanism of a GNN is message passing. During training and inference, each node aggregates information ("messages") from its neighbors.
1-hop: A user node learns features from the devices and merchants it connects to.
2-hops: The user node learns from the other users who used that device, or the other merchants transacted with by those users.
This allows the GNN to generate node embeddings — rich numerical vectors that encapsulate not just the user's behavior, but their network position.
Example: A GNN can detect "guilt by association." Even if customer A's transaction looks normal, if they are connected via two hops to a known mule account, the GNN will propagate that risk signal to customer A's embedding.
Result: The model detects fraud rings, synthetic identities and collusive merchant fraud that are invisible to tabular models, improving detection accuracy.
| Characteristic | Traditional ML models (e.g., Random Forest, XGBoost) | Graph neural networks |
| Core data model | Tabular (rows and columns). | Graph (nodes and edges). |
| Unit of analysis | The individual transaction or entity, in isolation. | The node and its multi-hop relational neighborhood. |
| Feature engineering | Manual, static and human-driven. Relies on domain experts to define features (e.g., velocity checks). | Automated, dynamic, and relational. Learns features directly from graph structure via message passing. |
| Key detection pattern | Point anomalies. Finds outliers (e.g., unusually large transaction, transaction from new location). | Computationally complex. Requires graph data infrastructure and can be sensitive to graph quality and sampling. |
| Primary failure mode | Structurally blind to coordinated, network-based fraud that looks normal at the individual transaction level. | Computationally complex. Requires graph data infrastructure and can be sensitive to graph quality and sampling. |
| Core question asked | "Does this transaction's features look fraudulent?" | "Does this transaction's neighborhood look fraudulent?" |
Thoughtworks has been collaborating with AWS and NVIDIA on a PoC to jumpstart client interactions. Interest in GNNs has been amplified by NVIDIA’s initiatives in this area. It has introduced the NVIDIA AI Blueprint for financial fraud detection that is leveraging GNNs for high-performance financial environments.
This blueprint is not merely theoretical; it provides reference code, deployment tools, and a reference architecture for developers to solve the specific engineering challenges of deploying GNNs: data volume and inference latency.
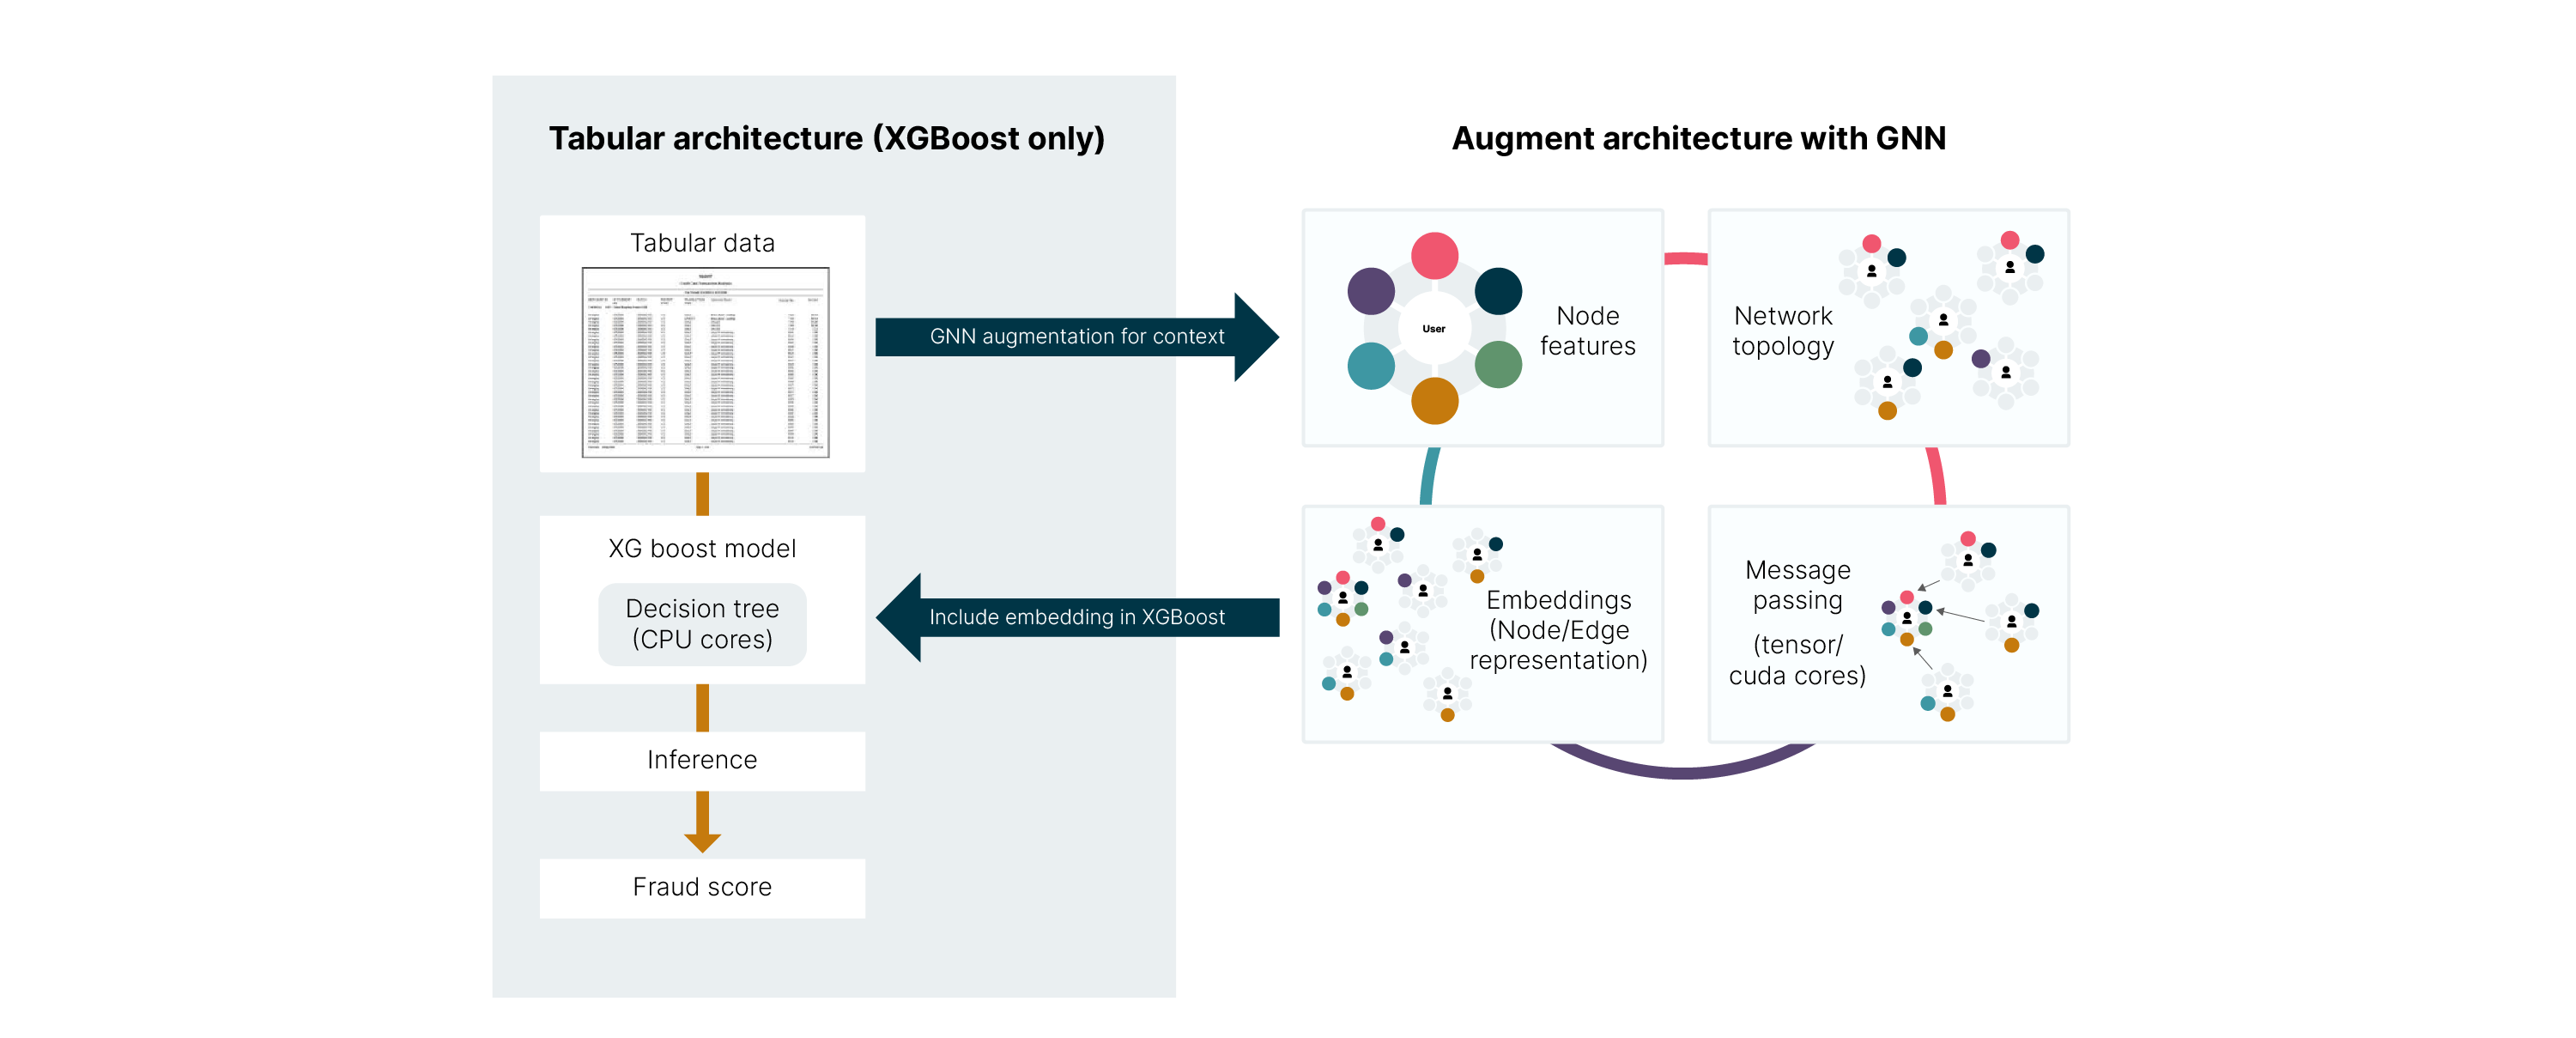
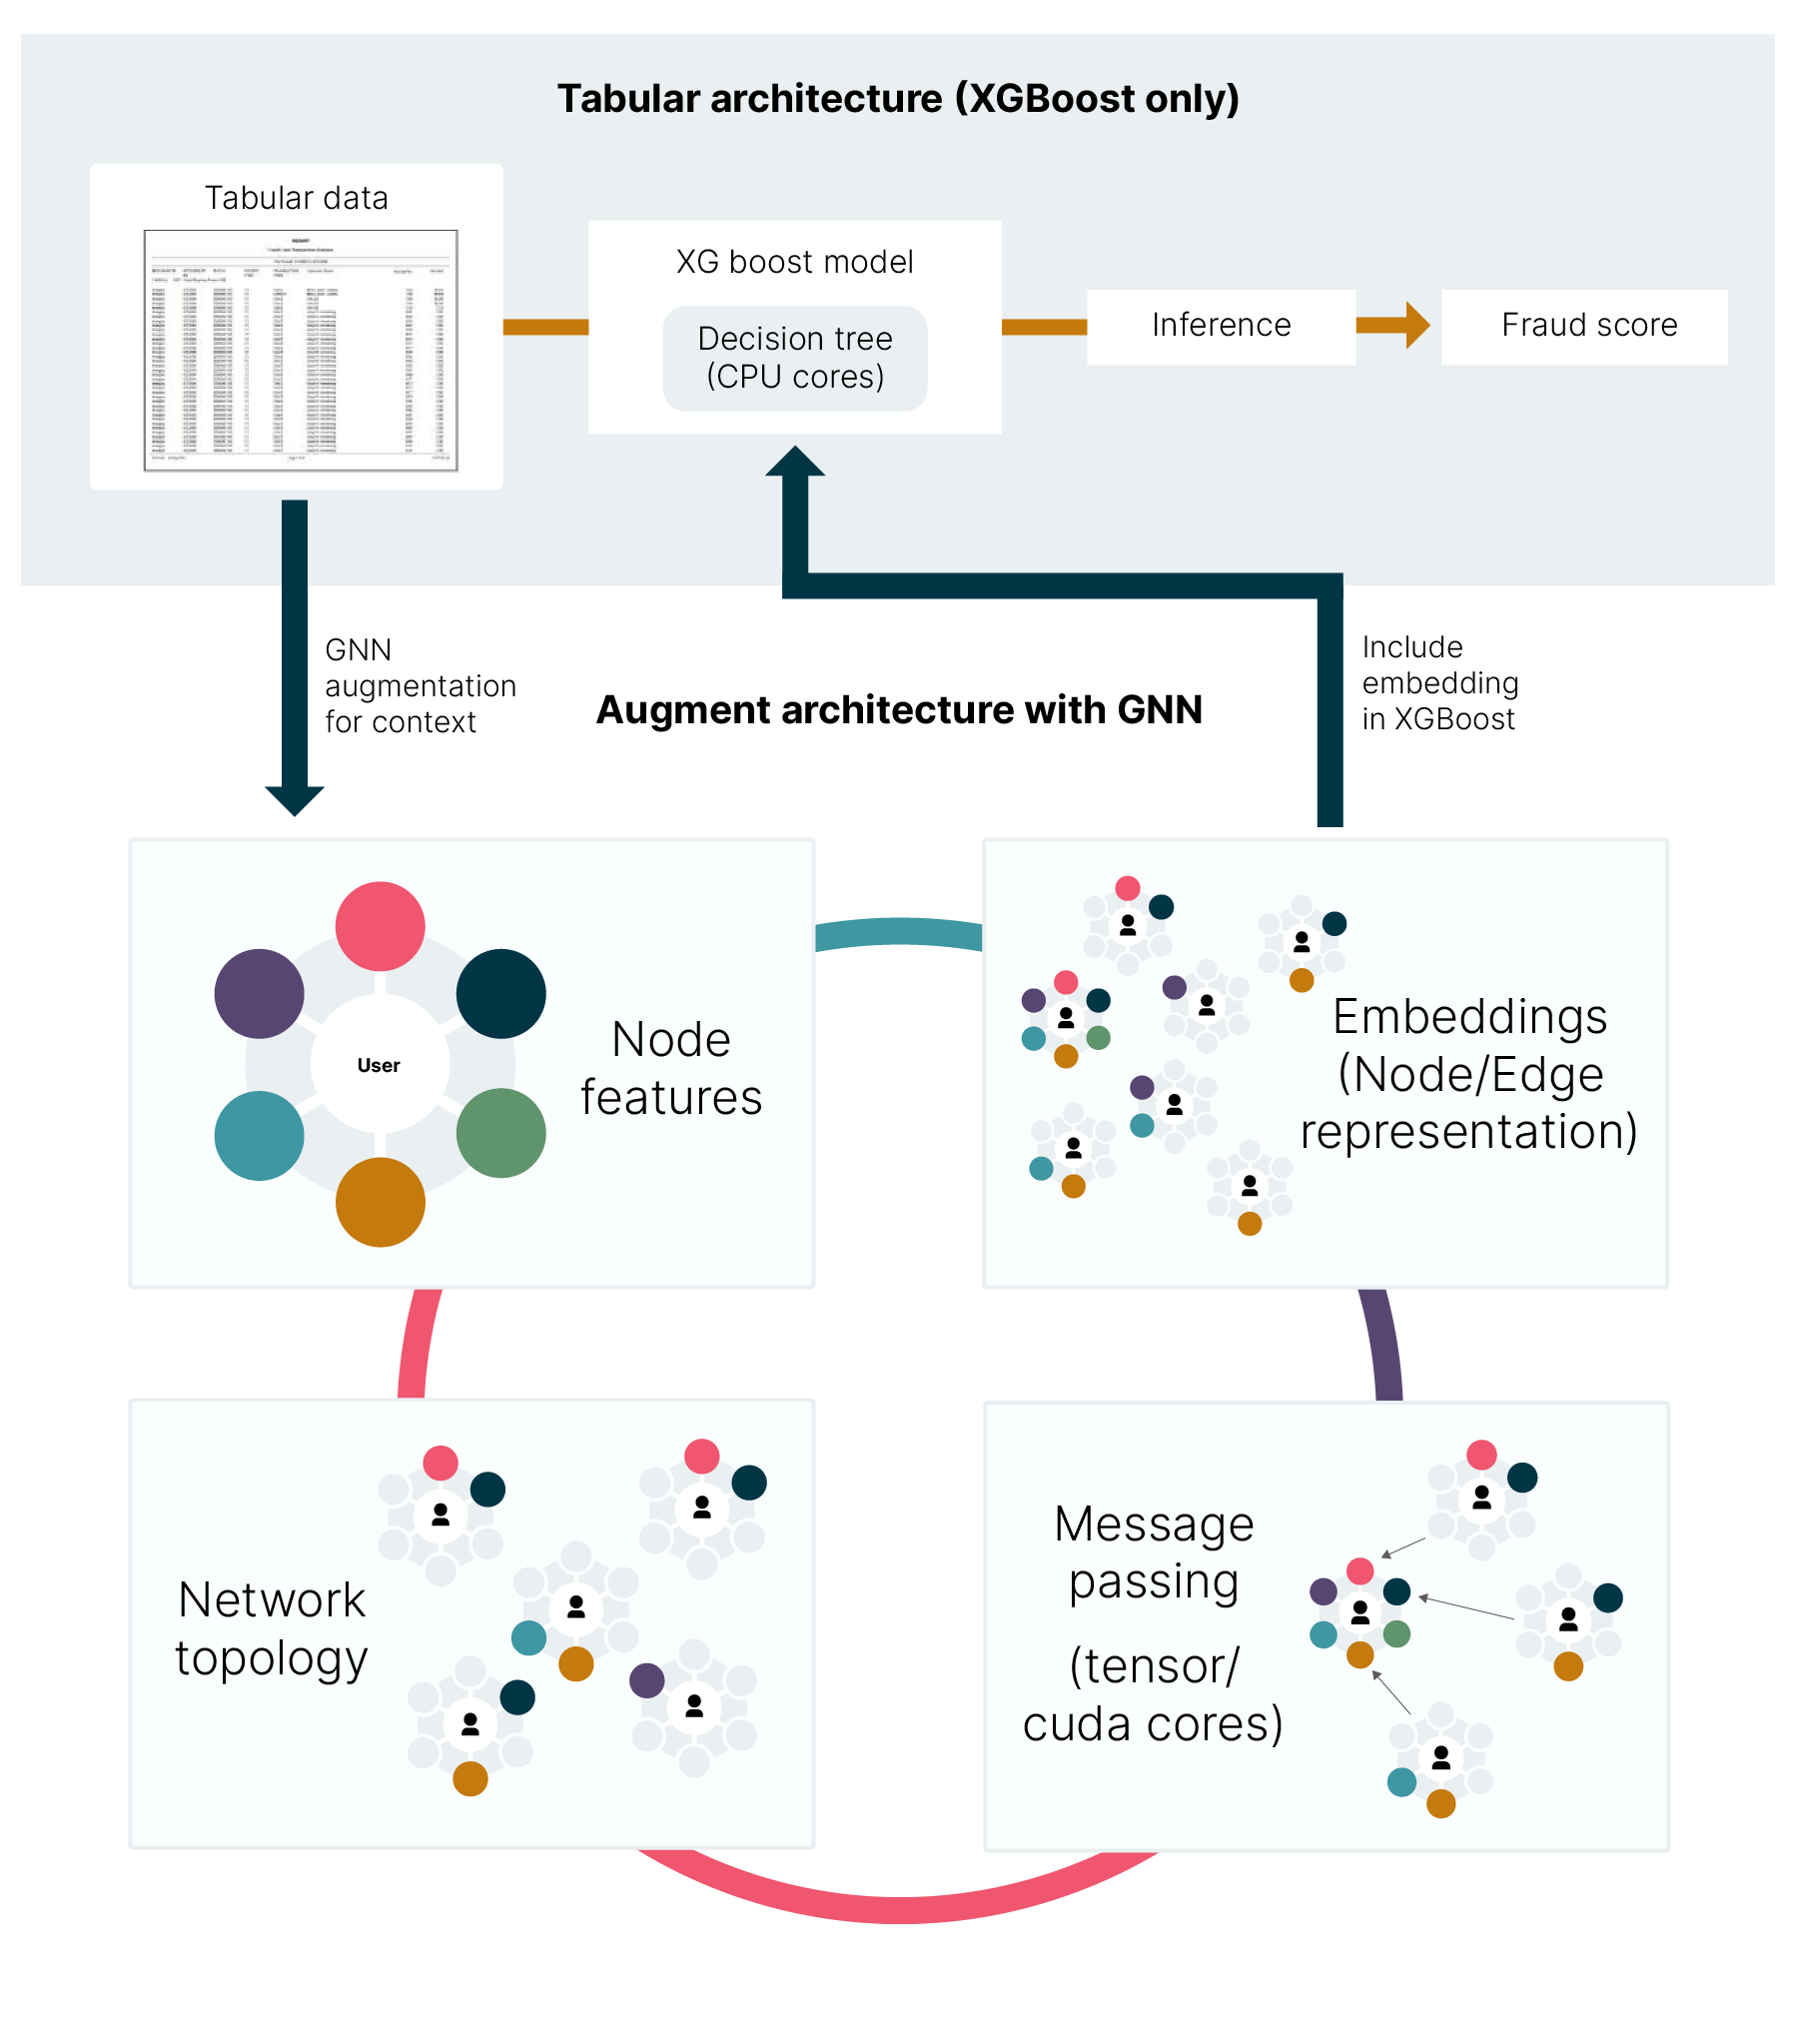
The core innovation of the NVIDIA AI Blueprint for financial fraud detection is its reference architecture, which moves beyond the choice between tabular models and graph learning. Instead of replacing the industry-standard gradient boosted methods (XGBoost), this architecture leverages the GNN as an upstream feature factory. The GNN's role is to process the complex network topology of the financial graph and output dense, numerical node embeddings that mathematically encode the relational risk. This embedding is then concatenated with the traditional tabular features and fed into the XGBoost model for the final fraud/non-fraud decision.
This approach combines the network intelligence of GNNs with the speed and regulatory-mandated explainability of XGBoost. This is built using the NVIDIA RAPIDS suite of GPU-accelerated data processing libraries, primarily cuGraph or the GNN, XGBoost from cuML, and data prep from cuDF.
This NVIDIA AI blueprint is broken down into three steps, which map to processes within a typical payment processing environment, those steps being: (1) Data Preparation, (2) Model Building, and (3) Inference. Additionally, within a production system, the event data would most likely be saved within a database or a data lake. For this example, the data is just a collection of files with synthetic data.
Based on the NVIDIA AI Blueprint for financial fraud detection, here is an example of the end-to-end pipeline a single new transaction follows, from the moment it occurs to the final fraud decision. This pipeline uses a "subgraph inference" architecture to handle the massive scale of financial graphs while meeting millisecond latency requirements.
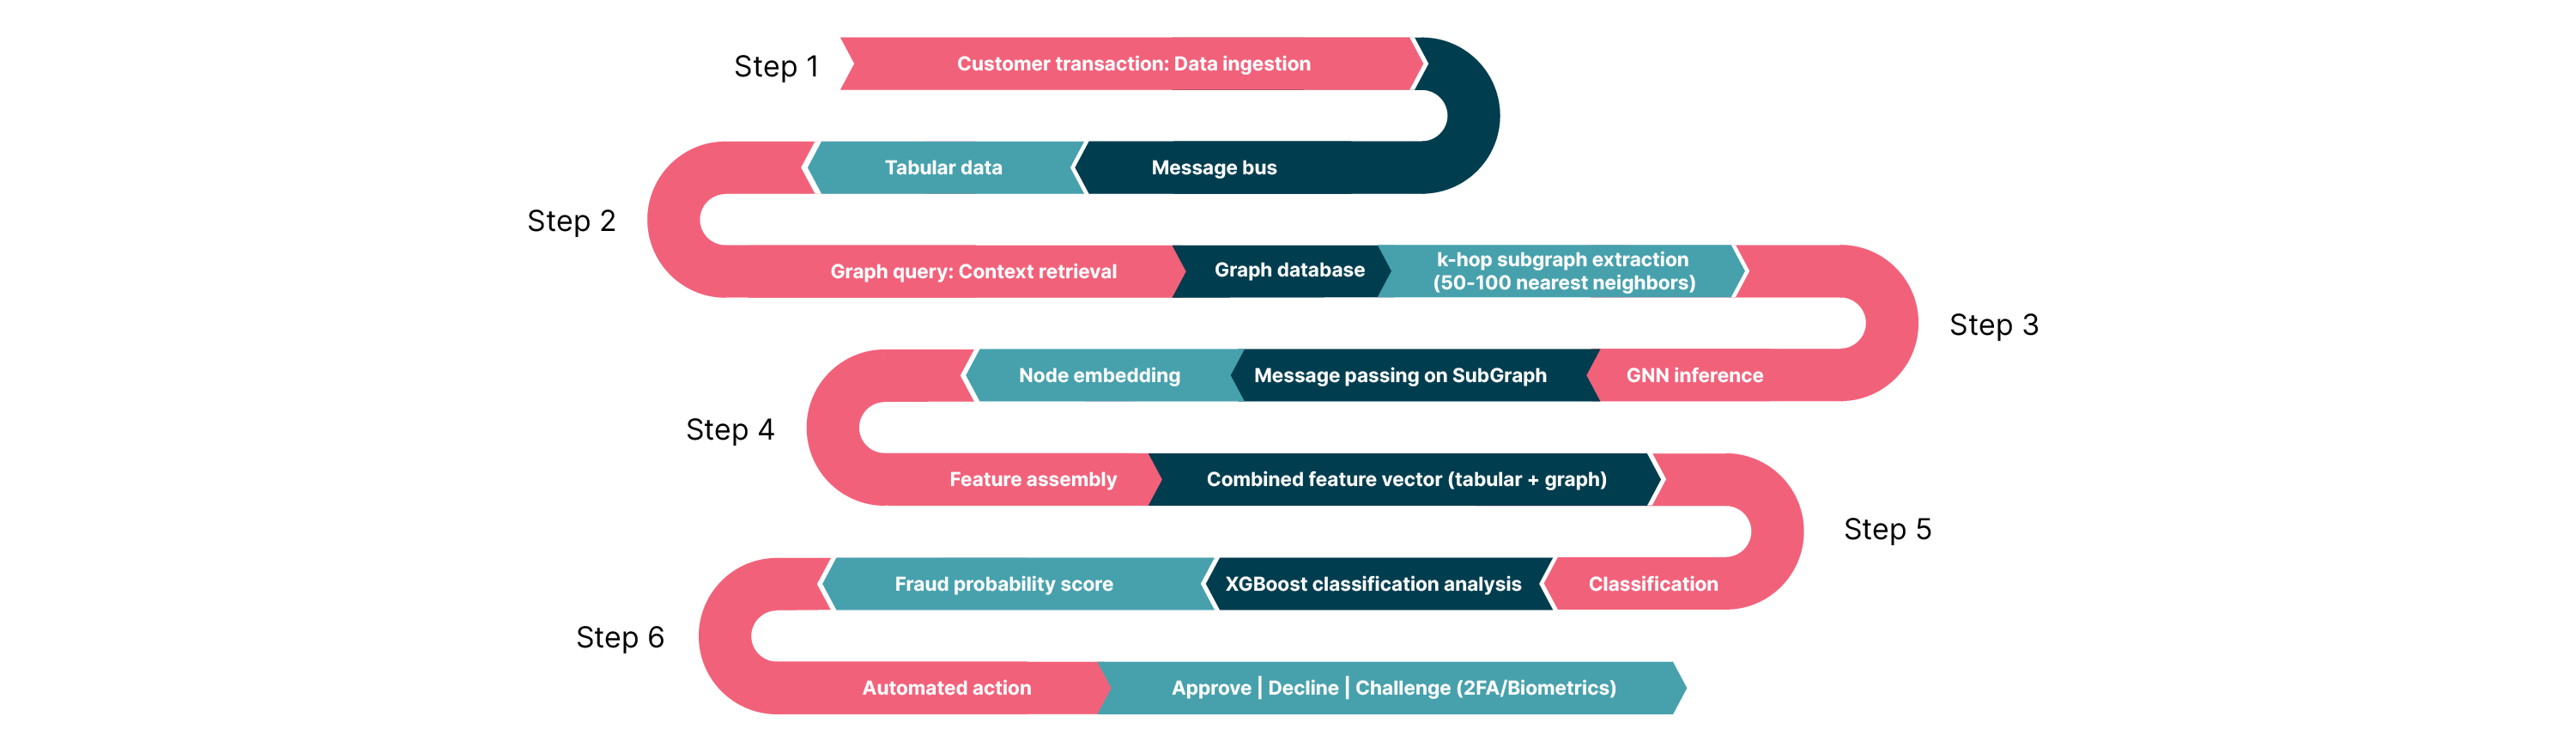
In the diagram above the steps are the following:
Step 1: The event trigger (ingestion)
Event: A customer swipes a credit card or initiates a transfer.
Action: The transaction details (amount, merchant ID, timestamp, etc.) are streamed instantly via a message bus, such as Apache Kafka.
Data: At this stage, the system only has the raw "tabular" data of the current event.
Step 2: The graph query (context retrieval)
Action: In a production setting, the system queries a high-performance graph database (like Amazon Neptune or TigerGraph) to fetch the “local neighborhood” around this transaction.
Step 3: GNN inference
Engine: This subgraph is processed by the graph neural network (hosted on NVIDIA Triton Inference Server or Amazon SageMaker).
Process: The GNN performs "message passing" only on this small subgraph. It aggregates information from the neighbors to understand the relational context.
Output: The GNN outputs a node embedding — a dense numerical vector (e.g., 64 floats) that mathematically summarizes the risk of the transaction's network (e.g., "This node is central to a cluster of known fraudsters").
Step 4: Feature assembly
Concept: This step effectively "augments" the traditional data with deep forensic intelligence about the network structure.
Step 5: XGBoost classification (risk scoring)
Step 6: Action
Action: Based on the score, the decision engine triggers an automated response:
Approve: Transaction proceeds.
Decline: Transaction is blocked.
Step-up: System challenges the user with 2FA/Biometrics (if the score is inconclusive).
This workflow solves the historical trade-off between investigation depth and transaction speed. By decoupling the graph retrieval (Step 2) from the final decision (Step 5), and restricting the GNN to a localized subgraph, this architecture delivers deep, forensic-level network intelligence within the strict latency budgets (sub-100ms) of real-time payments.
Our analysis concludes that graph neural networks represent a genuine paradigm shift in risk management. They are not merely a better model but a different way of seeing and quantifying risk. For the strategic decision-maker, the question is not if this technology is powerful, but how to adopt it in a way that maximizes ROI and minimizes operational disruption.
And from what we’ve seen, the NVIDIA AI blueprint, which integrates GNNs with high-performance gradient-boosted decision trees (XGBoost), offers significant benefits over traditional methodologies. This hybrid approach (see below for details) doesn’t merely offer incremental gains but provides a transformative capability to model network topology in real-time, reducing false positives and delivering a quantifiable return on investment as evidenced by deployments at major global institutions.
For the vast majority of institutions with established, high-performing fraud systems, a rip-and-replace strategy is neither feasible nor desirable. The most practical, high-ROI and lowest-risk path to adoption is a hybrid approach.
The strategy: This approach uses the GNN not as the final decision-maker, but as an incredibly powerful feature factory. A GNN is trained (often in batch, offline) to generate rich, numerical node embeddings for all entities in the graph (users, devices, accounts, etc.).
Implementation: These embeddings — which are simply dense vectors of numbers summarizing all the relational context — are then fed as new, powerful features into the existing models.
The benefit: This strategy delivers the best of both worlds. The existing models are augmented with the deep relational context from the GNN, significantly boosting its accuracy and, most importantly, its ability to reduce false positives. This provides a massive performance lift without requiring a complete re-architecture of the real-time decisioning engine. Furthermore, it preserves the explainability of the existing tree-based model, which is a critical requirement for regulation and analysis.
To fully leverage the power of GNNs, your data must be accessible in a network format. The most effective way to achieve this is by integrating graph database technologies into your existing stack, which solves the "graph construction" bottleneck by preserving relationships natively rather than flattening them into tables.
To manage risk and ensure a smooth transition, financial services institutions (FSIs) should adopt a phased implementation path:
Phase 1: Offline construction and shadow scoring. Begin by building the graph offline and running the GNN models in shadow mode to validate the F1-score uplift without impacting live production traffic.
Phase 2: Hybrid embedding injection. Transition to injecting the batch-generated GNN embeddings into live production systems (as outlined in Recommendation 1).
Phase 3: Real-time graph inference. Advance to full, real-time graph querying and low-latency GNN inference at the immediate point of transaction.
Investing in this graph-first data layer does more than just support fraud detection. It builds the fundamental infrastructure for future network-based initiatives, creating a scalable foundation for anti-money laundering (AML), systemic risk analysis and supply chain visibility.
The biggest uplift from GNNs is ultimately not just a quantitative improvement in a model's F1-score, but a qualitative re-definition of risk scoring itself. The future outlook for risk scoring is moving from a static, isolated and reactive process based on known patterns to a dynamic, contextual and predictive process that leverages emergent network structures.
Fraudsters have evolved from isolated actors into sophisticated, coordinated networks. They hide in the relationships that traditional models were built to ignore. GNNs are the class of machine learning models designed to fight these adversaries on their own terms: by modeling, analyzing and ultimately thinking in networks.
The hybrid path we have outlined offers a pragmatic way to navigate this shift. It does not require abandoning the investments made in existing tabular models. Instead, it augments them by using GNNs as a powerful feature factory that feeds rich, structural context into your current decision engines. This approach delivers the best of both worlds: the stability and interpretability of established models combined with the networked intelligence of graph learning.
The technology to execute this — real-time sub-graph querying, low-latency inference and scalable GPU acceleration — is available, effective and production-ready today.
Ultimately, while the strategic case for GNNs is compelling, institutions must evaluate adoption through the lenses of regulatory explainability, data governance maturity and operational readiness. The shift toward relational intelligence is not just technical. It is an organizational transition.