


This blog post talks about measuring the execution time for each step and reporting it in Twist HTML reports. This is very helpful to analyze application performance and it also makes it easy to spot parts of the application that aren't performing well. This is the first part of a two-part blog series. The second part talks about consuming this data and drawing a little graph in the HTML report.
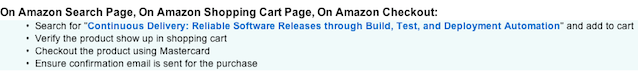
Twist provides two types of execution hooks. A global and a fixture level hook. In this blog post, we will be using a global hook to measure the execution time for each step in the scenario. We use the Twist data store to keep the measurements. Twist by default renders data store contents as HTML reports. Let us assume we have a scenario like the following:

We use the hooks defined in "ScenarioExecutionHooks" class.
public class ScenarioExecutionHooks {
@Autowired
private TwistScenarioDataStore scenarioStore;
private long startTime;
@BeforeEachStep
public void beforeEachStep() throws Exception {
startTime = System.nanoTime();
}
@AfterEachStep
public void afterEachStep() throws Exception {
double elapsedTimeInSec = (double)(System.nanoTime() - startTime) / 1000000000.0;
IScenarioInformation scenarioInformation = ScenarioInformationFactory.getScenarioInformation();
scenarioStore.put(scenarioInformation.getCurrentStep().getText(), elapsedTimeInSec);
}
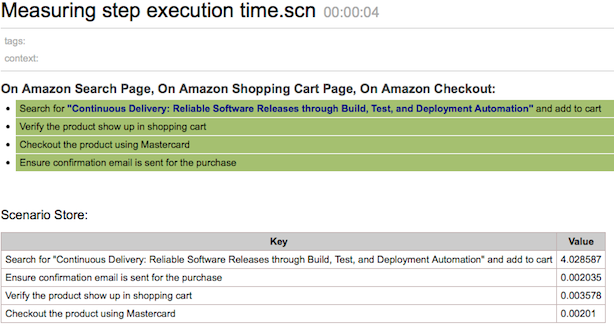
}"beforeEachStep" method records the execution start time and "afterEachStep" method records the elapsed time. Finally we add the details into scenario store. Twist will put the scenario store into the HTML report. Below is a preview of the HTML report:

Identifying performance regressions
Measuring the elapsed time can also be used to detect performance regressions. If performance regressions are detected, you can fail the scenario if required. To do that, we will tag the scenario with a tag named "should_execute_within_10_secs" (tags are customizable, "should_execute_within_10_secs" is a just an example). In the "after" hook, we will check the elapsed time and fail if necessary. "should_execute_within_10_secs" tag can be used to detect the scenarios where this check is required.
@AfterEachStep
public void afterEachStep() throws Exception {
double elapsedTimeInSec = (double)(System.nanoTime() - startTime) / 1000000000.0;
IScenarioInformation scenarioInformation = ScenarioInformationFactory.getScenarioInformation();
scenarioStore.put(scenarioInformation.getCurrentStep().getText(), elapsedTimeInSec);
String[] tags = scenarioInformation.getTags();
for (String tag : tags) {
if ("should_execute_within_10_secs".equals(tag)
&& elapsedTimeInSec > 10.0) {
fail("Expected to execute within 10 seconds. But took "
+ elapsedTimeInSec + " seconds");
}
}
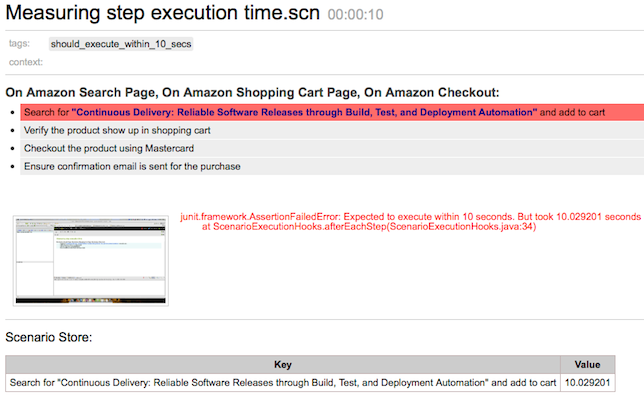
}The report will look like,

Check out our next post, where we explain how to consume this data and plot a little graph on the report.
See what's new in Twist 13.1 on our community site or Try Twist now.
Disclaimer: The statements and opinions expressed in this article are those of the author(s) and do not necessarily reflect the positions of Thoughtworks.