


A small team from the Thoughtworks Recife office recently built an open data application in response to call for entries by the Ministerio da Justiça of Brazil. The application was awarded second prize in the contest.
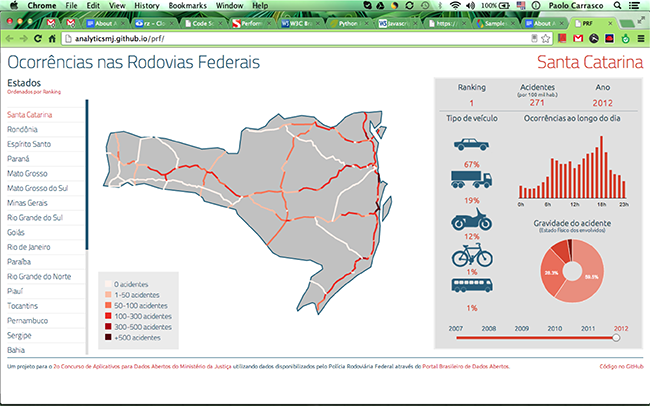
The main goal of the app was to expose information related to accidents on federal roads by using data created by the Polícia Rodoviária Federal between 2007 and 2012.
A second goal of the project was to raise awareness among the states about the accidents they had in their roads: e.g. critical times of the day, types of vehicle, any road sections with more accidents, and the gravity of the accidents.

When we started this project the following challenges were laid out:
- Gathering data and generation of information. Starting from the dataset provided for the contest, we faced all sorts of problems dirty data can have. Referential integrity problems, missing data, wrong data, etc. The dataset was massive, so although we ended up losing about 5% of the initial amount of data, it still produced a meaningful set of statistics.
- Usage of maps to show data. The team decided to show maps of the states so it can be easy to see the most accident-prone roads. That created a big challenge:
- Rendering the map using SVG. First problem was where to find the georeferenced open data, then the problem was how to transform it into something the browser could render. We discovered kartograph, a lib that can convert shapefiles into SVG, which every HTML5 browser can render. Then we ended finding out that the National Transit Department (DNIT) has shapefiles that corresponds to every road in the country. So both data for every state were merged and problem solved!
- Mobile devices. The final app should be seen from a mobile device too, either a phone or a tablet. We decided to focus only on the mainstream devices: iOS and Android.
- Deadline. The project had a timeline of a month, so we had to prioritize the main tasks to finish the system.
- People involved. The team had different people along its lifetime. And some people involved were not able to be involved 100% due to their engagement with their projects.
Features
Responsiveness
The app is responsive, so it adapts to the resolution of the device and the characteristics of it. In order to achieve this responsiveness it uses CSS3 media query expressions instead of javascript hacks. The app always could be seen in good shape even when printing.
One of the tough calls we had to make was to remove the map when in smaller screens, like smartphones. The rationale we followed was that it would be very difficult for the user to see the whole app, like the roads presented in the maps of these screens.
Great Performance
The application now renders completely in less than two seconds (even faster on mobile). To reach this performance we followed the good practices in the web app development (javascript and css externals, css declarations at the top, javascript declarations at the bottom, minimal DOM access) as well as some of the suggestions of the YUI team: few requests to the server (the final product is a single page app), the number of DOM elements was optimized, the javascript and CSS files were combined and minified (by using r.js), event handler delegation, use of horizontal image sprites. Regarding the images, we used one main image throughout the app: the vehicle-types.png, that contains a sprite with all the vehicle types we used. The vehicle types are rendered inside img tags, so it is not a CSS sprite, we had to use a different approach to make the image responsive.
HTML and CSS Compliance
The markup of the application passed the validation of the W3C organization and can be seen well in browsers that follow the HTML5 specs. The main CSS files we used for the application (main.css, responsive.css) passed most of the validation with just one error.
Technologies Used
Data was gathered from the Brazilian Government open data repository (dados.gov.br) and analyzed with the help of MySql. Geospatial data was collected from the National Transit Department (DNIT) and merged with quantitative data with the help of Qgis.
GIS data was exported as SVG with the help of kartograph.py and consumed with its javascript variation, which uses raphael.js. All other data was exported as json.
The website is a single page, responsive, client side app using mainly knockout.js and require.js. Charts were drawn with the help of google charts api and chroma.js.
It is an open source application under the AGPLv3 public License.
The technologies used in the project were:
- Javascript
- Require.js
- Knockout.js
- Google Charts API
- Kartographic.js - Raphael.js
- HTML5
- Semantic Tags
- SVG
- CSS3
See it in action here: http://analyticsmj.github.io/prf/
And here a few pictures of the app in different devices (picture taken http://modern.ie):

Disclaimer: The statements and opinions expressed in this article are those of the author(s) and do not necessarily reflect the positions of Thoughtworks.