


Visualising data provides clarity, increases engagement and delivers unexpected insights. A rapid and adaptive approach to building visualisations can help you realise value with a minimal investment.
Sharing what we’ve learned about data visualisation
Thoughtworks shared these thoughts and client stories from our work in Perth and Melbourne at an evening briefing in Perth, Western Australia, on 29 October 2013. We talked with a large and enthusiastic audience from diverse backgrounds, all with a common interest in visualising data.
We talked about the origins of visualisation, how visualisation is used today, and discussed why we visualise. Then we walked through client stories showcasing:
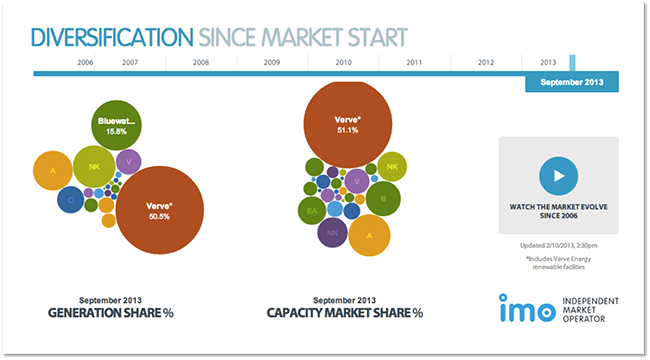
- communications uplift for an energy market operator,
- operational insights for a major call centre operator, and
- management clarity at a safety management authority.
We showed how compelling results could be generated very quickly with a rapid and adaptive approach. Of course, all stories were illustrated with beautiful animated visualisations!
Evolving the visualisations

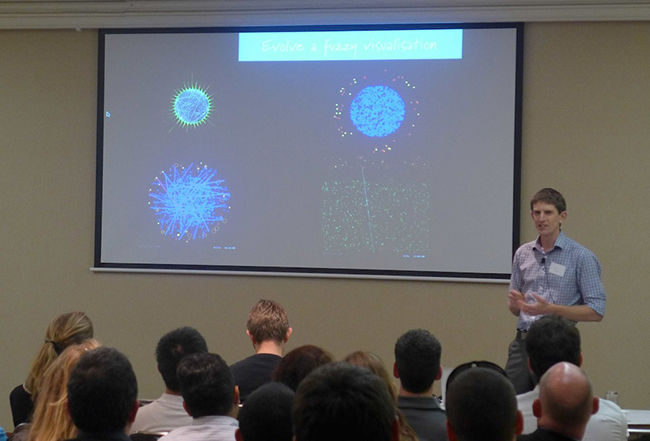
Above: David shows the evolution of the Call Centre visualisation.


Above: And final result, inspired by the film The Matrix.
To dive deeper, take a tour of the presentation with the slide deck, and get the full story and the many live interactive examples in the video of the presentation.
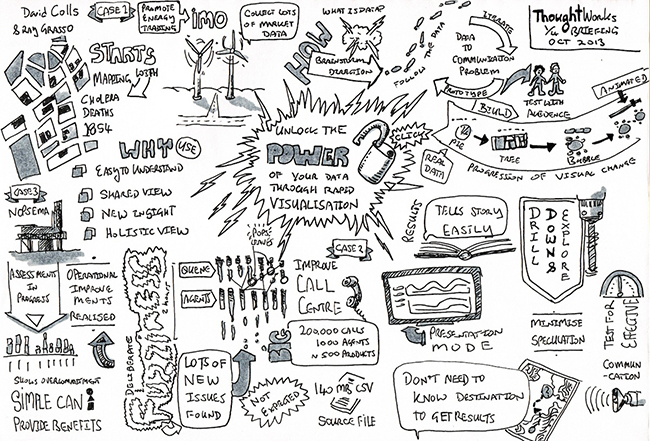
A few sketch notes from the evening
Gary Barber, an independent user experience consultant, was there and, in the spirit, shared this visual summary of the event.

Try these for yourself
Visualisations are even more engaging when they’re interactive - try these for yourself!
Electricity market
See the Western Australian electricity market from a new perspective.

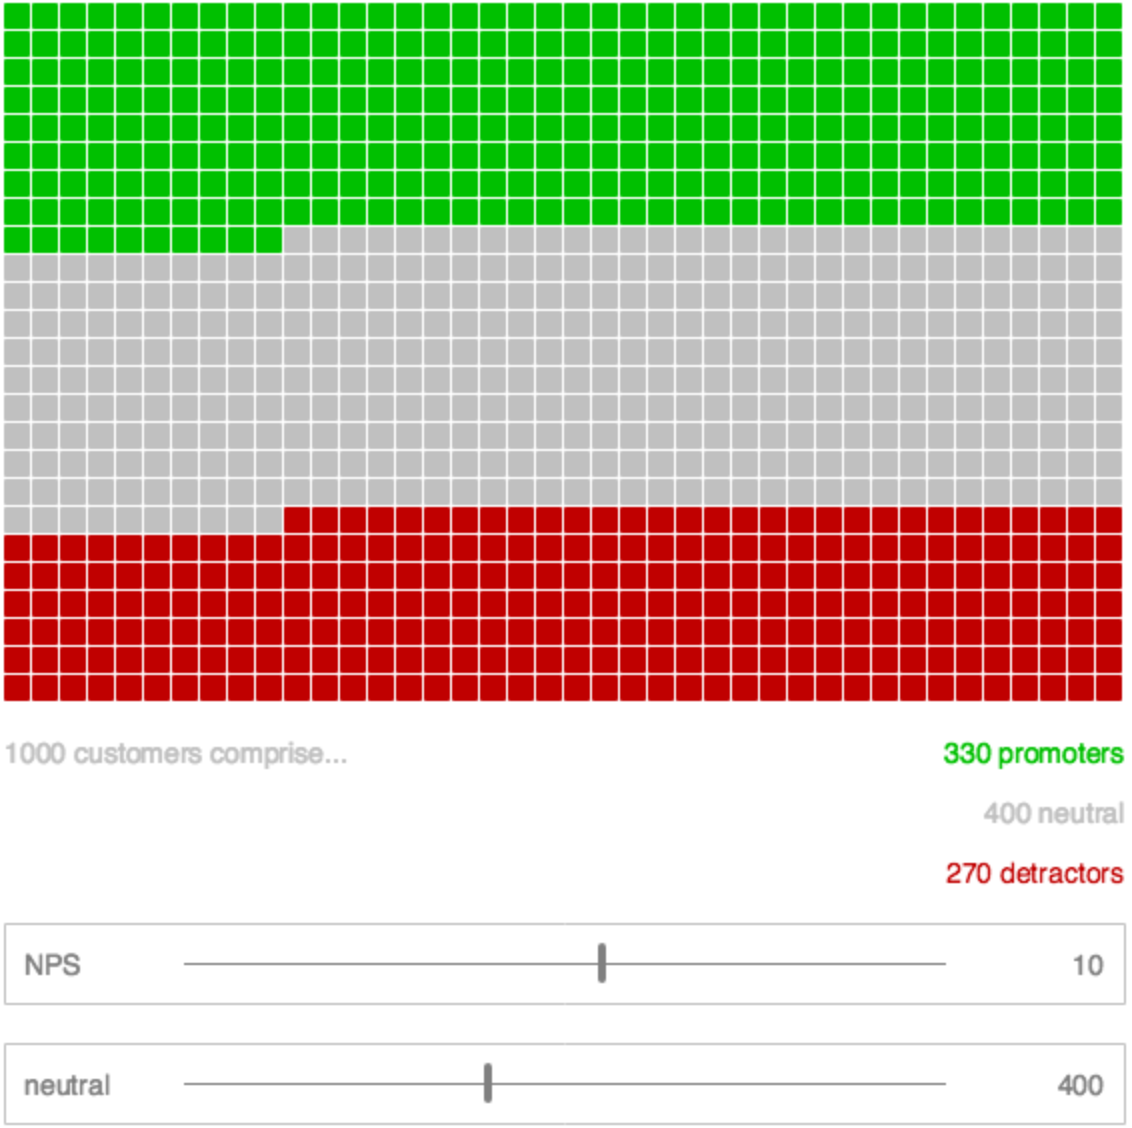
Net Promoter Scores done visually
Here we paint a picture with a widely used but poorly understood metric: Net Promoter Score. The visualisation shows what NPS purports to tell you about your customer base.

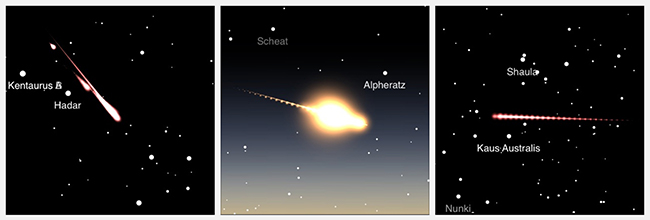
Fireballs in the Sky
And here’s one you can try on your mobile device. Visualisation is key to the citizen science app (iOS, Android) developed by Thoughtworks Perth for the Fireballs in the Sky programme. The main characteristics of the meteorite are captured and brought to life with a stunning animation set on a reconstructed night sky background. Numbers that would otherwise only appeal to a hardy cadre of astro-geologists become so engaging that users can’t help but create their own “designer” meteorites.

Why visualise?
Let’s review why we visualise and why it’s good for business.
Why visualisation is great for humans
- Ease of understanding. We comprehend data through spatial relationships and metaphors.
- Holistic view. Nothing gives you the big picture like a big picture.
- Shared view. With an accepted visualisation, teams can direct their energy to action.
- New insight. A visualisation will show you things you didn’t design it to.
Why visualisation is good for business
- Engaging communications build your brand and align your workforce
- Operational visibility gives a clear picture of your organisation
- Operational insight comes with seeing your data from a new perspective
Rapid and adaptive: results within weeks
You can achieve these results within weeks with the right team and a rapid and adaptive approach - an approach that can be adapted to communications or gaining insight and conducting investigations.
Talk to us
Get in touch with us if you would like to learn more about data visualisation at Thoughtworks. David Colls is a lead management consultant with a mathematical visualisation bent (find him on LinkedIn or read his blog). Ray Grasso is a lead developer consultant who enjoys thinking up and building products (@grassdog).
Disclaimer: The statements and opinions expressed in this article are those of the author(s) and do not necessarily reflect the positions of Thoughtworks.