
Legacy modernization
Escaping the legacy black hole: How insurers can turn technical debt into agility

For 30 years, the operational database and the analytical database have been two artifacts, two governance planes, two budgets and, usually, two on-call rotations, connected by an ETL job someone wrote in a hurry and nobody wants to own. That split was never a design choice; it was a physical constraint. OLTP and OLAP had genuinely different storage layouts, different compute profiles and different failure modes, so we built two platforms and wired them together after the fact.
That constraint is dissolving. When storage is shared, compute is serverless and isolated per workload and governance lives at the catalog layer. ‘Operational’ and ‘analytical’ stop being architectural categories and become access patterns against the same foundation.
To test whether that's actually true in practice, we took Backstage, Spotify's notoriously state-heavy internal developer portal (IDP), ripped it off its standard Postgres database, and pointed it at Databricks Lakebase. Across this three-part series, we'll explore what happens to deployment cycles (part one), governance (part two) and FinOps (part three) when you collapse the wall between the operational app and the data platform.
Lakebase exposes a serverless Postgres surface (leveraging Neon's architecture under the hood) that lives inside the Databricks Platform. Because it speaks wire-protocol Postgres, Backstage doesn't know or care that it isn't talking to RDS.
Getting it connected required pointing app-config.yaml at Lakebase and swapping Backstage's default in-memory search for PgSearchEngine. One immediate hurdle: Lakebase rejects classic Databricks Personal Access Tokens, expecting an OAuth JWT instead. The CLI provides databricks postgres generate-database-credential which generates a scoped, short-lived JWT for a specific endpoint, the intended approach for apps and CI. For this POC, we wrapped that command in a lightweight cron script that rewrote the DATABRICKS_TOKEN in our .env file every 50 minutes to handle the token expiration.
With auth sorted, the Knex migrations ran cleanly, and the portal was live.
The most underappreciated thing about a traditional Postgres database isn't its feature set, it's the tempo it forces on the teams that own it.
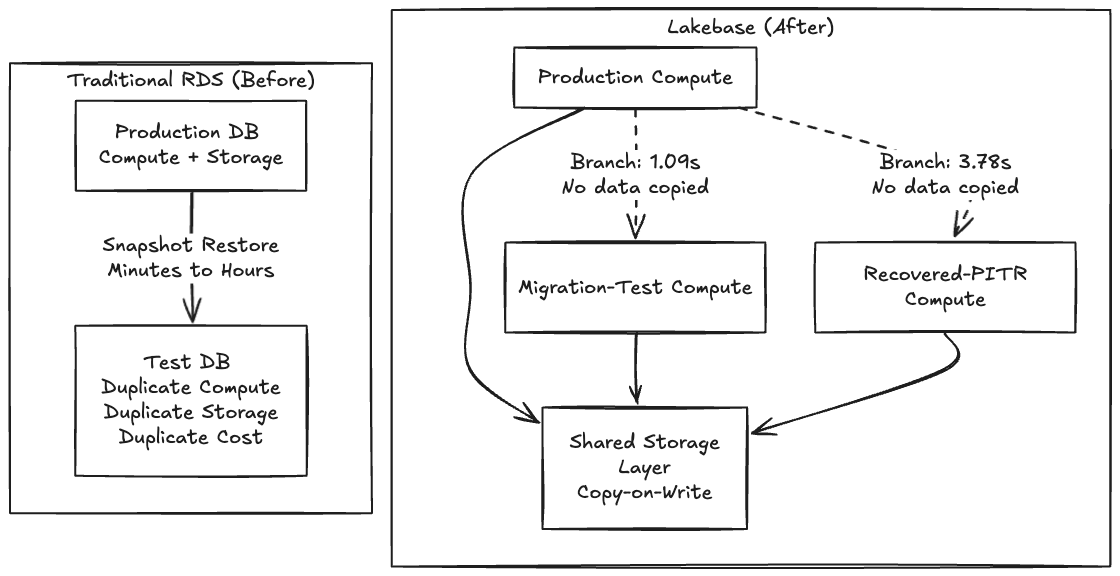
Thoughtworks has been a consistent advocate for Backstage as an IDP foundation through the Technology Radar, so along with being very familiar with the tool, we chose Backstage for this POC because its schema migrations are notoriously fragile, so it seemed like a perfect opportunity to test out a Lakebase integration. On a traditional RDS, testing a risky migration means waiting minutes or hours for a snapshot to restore into a parallel instance. Because making a copy is slow and expensive, teams simply don't test. They cross their fingers and run the migration in a maintenance window.
When making a copy becomes free, you stop asking "is this change safe enough to run?" and start asking "which fork of production do I want to try it on first?"
Because Lakebase separates storage from compute using a copy-on-write architecture, creating a branch doesn't copy any data, it creates a pointer to the same underlying pages, and only diverges on write. That's why the operation is instant.

One gotcha the docs don’t make obvious is that the request body must nest everything inside a spec object, and you must specify ttl, expire_time, or no_expiry. Without that, the API returns "Expiration must be specified."
$ databricks postgres create-branch \
    projects/cam-db-lakebase-test \
    migration-test-20260408 \
    --json '{
      "spec": {
        "source_branch": "projects/cam-db-lakebase-test/branches/production",
        "ttl": "3600s"
      }
    }'
The control plane acknowledged it instantly. The actual data-plane clone of the ~63 MB Backstage catalog landed in 1.09 seconds.
Branching and point-in-time recovery (PITR) are essentially the same primitive: branching is just PITR with source_branch_time = now. To test recovery against real deleted data, we wiped our final_entities table, dropping the count from 32 to zero.
We then created a recovery branch from a timestamp captured seconds before the delete:
$ databricks postgres create-branch \
    projects/cam-db-lakebase-test \
    recovered-20260408 \
    --json '{
      "spec": {
        "source_branch":      "projects/cam-db-lakebase-test/branches/production",
        "source_branch_time": "2026-04-08T22:56:02Z",
        "ttl": "3600s"
      }
    }'
The elapsed time end-to-end was 3.78 seconds.
Verifying the data confirmed the recovered branch had all 32 entities back; production was still at zero, confirming the delete was real and the branches are fully isolated. Notably, we asked for 22:56:02Z, but Lakebase snapped to 22:55:50Z, 12 seconds earlier, snapping backward to the nearest WAL record. This WAL-level granularity is an important caveat for time-sensitive recovery workflows, but the incident cycle still ran in under a minute.
When database state becomes a cheap, forkable artifact instead of a two terabyte EBS volume, every risky operation gets a dry run and every incident gets an undo.
As shown above, it proves that database branching works: a one second clone, a four second recovery and a real application that doesn't know the difference. But there's a gap between "the database can branch" and "my team branches the database as naturally as they branch code." Closing that gap is where the massive impact on developer productivity can be realized in objective gains.
We’ve spent the last several months working with development teams to answer a specific question: what happens to a team's velocity when database branching becomes invisible? What happens when it's not a CLI command you run, but something that happens automatically as part of how you already work, in your editor of choice? Although work is underway on a VS Code/Cursor extension that synchronizes git and database branches automatically to prove this, the tooling is ultimately secondary to what it enables.
Across the teams we’ve had experience with, the sprint cycle without database branching looks like this:
Create a git branch for feature development.
Write mock objects for every database interface (MockUserRepository, MockOrderService, for instance) for testing purposes.
Write unit tests with a mocked or in-memory database (H2, SQLite).
Submit a PR, get it reviewed and merge code.
Deploy to a shared staging environment.
Discover the schema migration doesn't work against real data or the size of data is a blocker.
Fix schema migration, redeploy, repeat.
With the availability of database branching capability, a developer’s feature development cycle changes:
Create a git branch — a Lakebase database branch can be created automatically in < 1 second.
Your IDE connects to the real branch database immediately.
Write code and run migrations against real live database data from the first line of code.
Write integration tests against the real database, not database mocks.
Multiple solutions can be experimented, since the rollback of database changes is trivial.
Push and open a PR — CI creates its own database branch, validates both code and schema, publishes a schema diff.
The QA team members can get their own database branch for destructive testing which can be reset in seconds.
Once merged the CD pipeline can migrate upstream environments like UAT and production and clean up all branches, code and data.
The mock objects disappear, the staging collisions disappear and the "works on my machine but breaks in staging" problem disappears. Developers get a live database to try multiple solutions. The database changes that used to be discovered at deployment are now caught during development, where they're cheap to fix. Instant branches for performance tests, disposable and isolated branches for functional tests and a running branch for UAT stakeholders becomes trivial.
In our experience, across multiple partner teams evaluating this workflow, mock objects account for 20-30% of test code. That's not test coverage — it's test infrastructure that diverges from production behavior over time, creating false confidence. When branching a production-equivalent database costs nothing, mocking becomes the expensive choice.
The question now is how much of your sprint are you spending on workarounds for a constraint that no longer exists?
In part two of this series, we will look at what happens to security and compliance when this operational database gets absorbed directly into Unity Catalog, Databrick’s unified governance layer.
This post first appeared on databricks.com.
Learn more about Thoughtworks' partnership with Databricks.
Disclaimer: The statements and opinions expressed in this article are those of the author(s) and do not necessarily reflect the positions of Thoughtworks.