Enable javascript in your browser for better experience. Need to know to enable it? Go here.

Set your tech priorities


Tech changes fast. But it’s becoming an ever-more critical component of success. Our Build Your Own Radar visualization tool will help you map out a tech strategy that will keep you ahead of the curve.

Watch this video to learn more.

The radar creation exercise invites you to have a conversation across all organizational levels and review your entire technology portfolio. This enables you to:


  • Objectively assess what's working, and what isn't
  • Pollinate innovation across teams and experiment accordingly
  • Balance the risk in your technology portfolio
  • Work out what kind of technology organization you want to be
  • Set a path for future success


How to build your Radar


You can create your own radar in two stages:


  1. Map out your ‘blips’ on a Google Sheet
  2. Use our radar visualization tool to create a shareable version.

Step-by-step guide

Create

To use the BYOR tool, you’ll either need to create a Google Sheet, or a hosted CSV or JSON file that’s publicly available.

Your file name plus the sheet name will be used as the title of your radar. Enter your content under each column (name, ring, quadrant, isNew, description).

Here's an example public Google sheet and a screenshot of the editable Google Sheet. This example sheet is based on the blips from the most recent Radar — but because the BYOR tool doesn't account for blip positions, the end result may be different to the published Radar.

Link

You can use Google Sheets or CSV/JSON file links to create the radar. If you’re using private Google Sheets, you will be asked to authenticate via Google Sign-in. 


Public Google sheet: If you plan to share your Radar with others, you can create a publicly accessible sheet.


How to publish a Google sheet:

  • In Google Sheets, click on “Share”

  • On the pop-up that appears, set the General Access as “Anyone with the link” and add Viewer permission.

  • Use the URL link of the sheet


Private Google sheet: If you prefer to keep your radar private, simply enter the Google sheet URL.


CSV and JSON file: You can also use the URL for a publicly available CSV or JSON file, for instance, one hosted on a public GitHub repository.

Build

On our visualization tool page, simply paste your URL into the input field and click "Build my radar".

Build my Radar

Note: You could previously build your own radar on radar.thoughtworks.com using custom quadrant and ring names. Going forward, on the online version of BYOR, you will need to use the 4 quadrant and ring names from the TW Tech Radar, as mentioned below:

Quadrant names: Techniques, Platforms, Tools, Languages & Frameworks
Ring names: Adopt, Trial, Assess, Hold

If you set up a local version of BYOR, you can configure custom quadrant and ring names. You can find more details in the readme file.


Ready? Lets get started.

Help and FAQs

Here's a list of things to check if your data is not loading into the radar visualization service.


Do you have an 'ad blocker' enabled in your browser? In some cases, these can interfere with the BYOR tool, so if you're having problems, it's worth checking.


If you are using a Google sheet, is it published? Do you have the rights to authenticate?


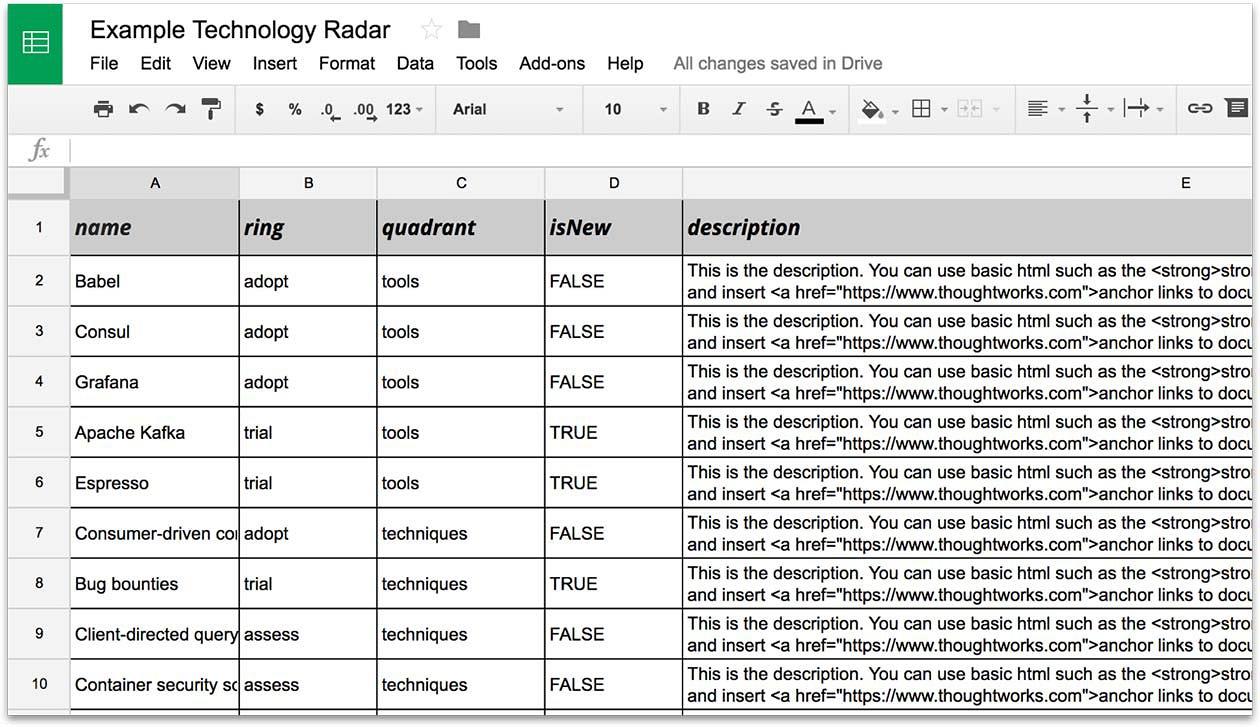
Does your Google Sheet or .csv file have the following column headers? 'name', 'ring', 'quadrant', 'isNew' and 'description'. Check the spelling and case, they are case sensitive, and check there is no whitespace before or after.


Does the 'quadrant' column contain four quadrant names? There need to be exactly four quadrants. Our radar contains the quadrants 'Tools', 'Platforms', 'Techniques' and 'Languages & frameworks'.


Check that you have consistent spelling for the data you're using in the 'ring' and 'quadrant' columns.


The service provides some basic error handling that might help you solve the problem and you may also find further clues in the console.

Yes, if you choose to make it publicly available and published via Google Sheets. Anyone who has access to or discovers the public URL will be able to view the information that you enter into your radar. Thoughtworks will collect data on how the service is being used, the URLs generated and may access any information you enter into your radar. We may use and publish aggregated and anonymised data from all the radars created using this service if we feel that it is interesting or could benefit the wider tech community. For full terms and conditions please read our privacy policy.


If you choose to use the private sheet option, only those with permission to access that sheet will be able to see your information.

Yes, the visualization service is open source (AGPL-licensed) so you can fork our repository or download a copy and host your own radar that's private. You can find the project repository here.

It’s currently in beta and provides just enough functionality to serve its purpose. We hope that it's useful to you and the wider tech community. If it proves popular and there's enough demand, we may introduce new features and additional services. Please tell us how you're using it and send us feedback here.

Yes, Thoughtworks is passionate about open source software and this is just one of our many open source projects. You can find the project repository here.

Credits


Like many of Thoughtworks’ best ideas, this service was inspired by work with one of our clients. Fotina Koutropoulos (PO/PM, BA), Emma Kitchener (Designer) and Fernando Freire (Developer) ran a session they called the platform agility radar and built the tool to visualize the output. Before this, both Bruno Trecenti and Brett Dargan had open sourced radar visualization tools. We are indebted to them for their work.