


Nearly three years ago we wrote about the “Missing Middle” in the innovation lifecycle[i], a gap that kept successful pilot programs from reaching the goal of replication and optimization in multiple contexts. Since then, scaling humanitarian innovation has received a great deal of attention from the sector, with a number of new initiatives specifically focused on the scaling challenge. This, in turn, has created a growing need for working tools to assess the readiness of a pilot innovation to proceed into the scale-up process.
The Scaling Assessment Map was developed by Ian Gray and Dan McClure to support the evaluation and planning for pilot innovation programs embarking on the Scale Up journey. This particular design for a scaling assessment is based on our prior work exploring the diverse challenges an innovation team must meet when working to create a sustainable ecosystem around their idea.
The map is an evolving design that is in the process of being used and refined with innovation teams and mentors. In the spirit of collaboration, we are presenting the map with the hope that additional perspectives and experience can help refine both the tool and scaling practices as a whole.
The challenge: assessing progress toward complexity
In our papers Engineering Scaled Up Innovations[ii] and Managing the Journey to Scale Up Innovation[iii], we worked to describe the unique nature of the design challenge that innovators face when they move from the fast moving expediency of a pilot project to the much more complicated and complex architecture of a sustainable scaled up solution. This transition into the “Missing Middle” of innovation requires a substantial shift in thinking and practices.
Instead of focusing efforts on the validation of original ideas, the innovator is now asked to architect a solution that has a strong value proposition, practical logistics, support from and engagement with an ecosystem of actors and organizational cultures, long-term management and maintenance capacity concerns, and a viable business and financial model. The routine series of omissions and compromises that were made during the pilot program to facilitate quick learning now become liabilities, gaps that must be filled to create a sustainable solution.
The challenge of scaling is being increasingly recognized, with a number of new initiatives springing up with the intent of fostering the Scale Up process. This is great news, yet we are still missing practical tools to assess the potential needs and readiness of pilot programs to transition into a Scale Up phase. Questions such as:
- Which programs are in a good position to Scale Up?
- What gaps exist in the strategic vision for a Pilot that is aspiring to scale?
- To what extent are gaps major barriers, or just simple problems to solve?
All need to be addressed. The scaling map helps innovation teams and organizations to identify the key components that need answers and investment in order to Scale Up successfully.
Finding the right level for a scaling assessment
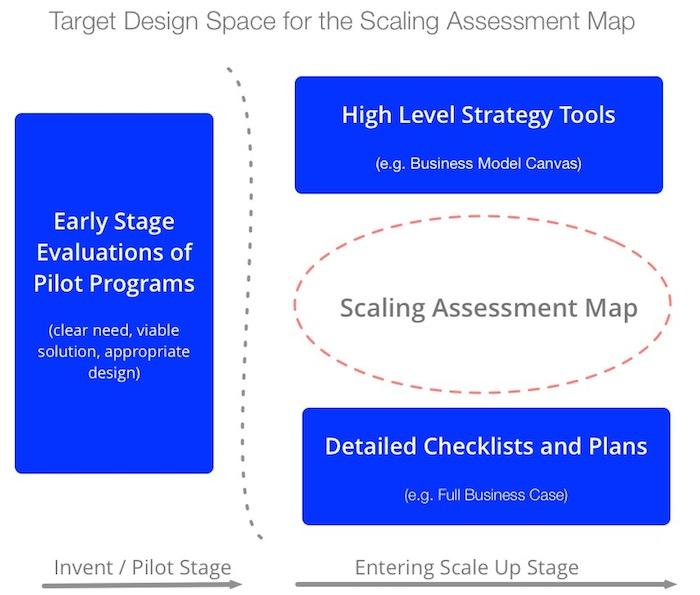
While there are a number of tools to capture business strategy, we did not find any that concisely captured the bread-and-butter elements of a sustainable scaled up solutions in sufficient detail to answer the questions posed above. Many of the existing tools circle what we believe to be the sweet spot in assessment design. Some focus further back in the innovation lifecycle, while others are either at too high a level or too detailed.
For example, a number of scaling assessments focus on the efficacy of the initial pilot program. Does the innovation solve an important problem? Is the solution well tested? Is there a broad demand? While these are important concerns, they might better be viewed as exit criteria for the pilot phase of the innovation lifecycle. These questions are the bare minimum starting point for Scale Up.

In our paper on Engineering Scale Up Solutions, we outlined a myriad of additional risks associated with completeness, compromise, connection and commercials that pilot programs moving to scale must address. The subsequent scale up journey, which builds a complex sustainable ecosystem around the innovation, brings with it a range of different dimensions that must be both architected and executed. These, including the innovation itself, are the operational ecosystem, adoption barriers, competitive alternatives, management, and financing.
Some existing business strategy tools such as structured “canvas” models (e.g. Business Model Canvas, Lean Startup Canvas) have been applied to the challenge of assessing scaling readiness. Skillful use of these tools can help innovators develop a high-level narrative, but by design, these stories are only ever just the headlines.
While the broad brushstrokes of strategy are visible, tools such as canvas models with their large general buckets are hard to audit. It takes additional, explicit effort to determine if key elements of a strategy might be missing and if relationships between the individual pieces are consistent with one another and form a coherent system that works end to end.
Embarking on the Scale Up journey requires a more complex view of the innovation. Some fine-grained assessment tools respond to this concern by swinging to the other end of the spectrum, capturing many details about future plans, but requiring multiple pages to provide this comprehensive view (e.g. a typical business case or project plan). These longer forms of assessment can be time-consuming to complete, difficult to review, and can leave innovation teams and their sponsors missing the ‘wood for the trees.’
Visual big picture model - MECE approach
The Scaling Assessment Map seeks to provide a bridge between high-level narratives and detailed inventories. Using one page, the goal of this tool is to identify and record the distinct pieces that need to be in place for Scale Up to have a good chance of succeeding. This comprehensive view is critical because the failure of any single element of an innovation’s scale up strategy can doom the initiative. Something as mundane as defining who will pay for maintenance can ultimately block a scale-up effort.
On one page, the map captures a broad range of elements necessary for the sustainable scale-up of a solution as outlined in our Engineering Scaled Up Solutions paper. It is a visual model that can be completed quickly (1-2 hours) by any innovation team. The goal is to provide innovators, mentors, and administrators responsible for scaling up an innovation a standardized view of the broad spectrum of concerns that must be accounted for when embarking on the Scale Up journey.
We’ve tried to use a Mutually Exclusive, Comprehensively Exhaustive (MECE) diagram approach, which we believe that it is particularly useful for this type of work. MECE diagrams are like tile floors where each of the elements is unique, breaking down component parts of a large complicated system, so that the elements do not overlap (mutually exclusive) but in combination cover the entire subject area (comprehensively exhaustive).
This type of visual model has several advantages for a Scale Up architect:
- Validation of Gaps – Because the entire subject is covered in the diagram, it is possible to identify where gaps exist (missing or empty tiles).
- Relationships – Because the elements don’t overlap its possible to group elements and show connections between either elements or the groups
- Completeness – While each element is not necessarily explored in detail, it is possible to see the entire subject at once in a single diagram.
- Potential Drill into Details – Particular areas of the diagram can be further decomposed into their own MECE sub-diagrams, allowing specific portions of the diagram to be explored in detail, while other portions are left at higher levels of abstraction. (see Additional Levels of Development below)

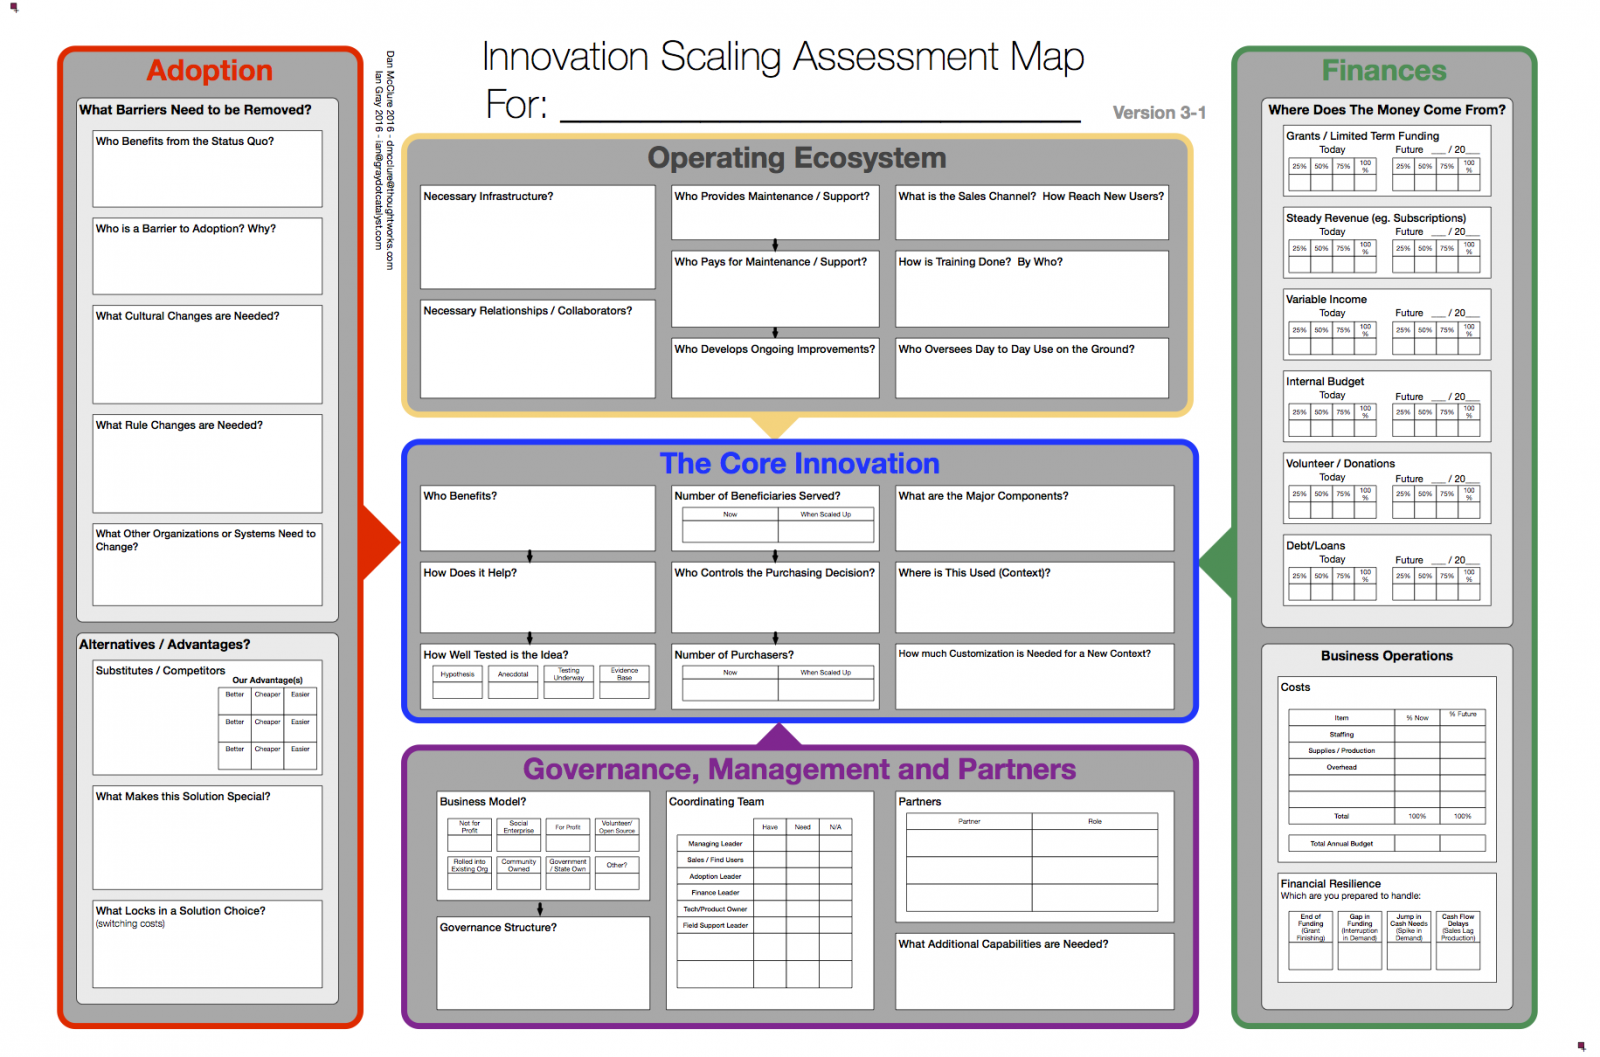
The current version of the scaling map has five major domains that are each broken down into component elements. At one level it is possible to see the sustainable solution in terms of its major architecture elements, value proposition, physical implementation, community, management, and finance. It is also possible to explore the elements of the solution design in greater detail by looking at the boxes within the big sections.
Workshop technique
In our testing of the scaling map in workshops, we have used lightly guided facilitation, allowing teams working on their map to have conversations among themselves as they progressively fill in the boxes. Work begins in the center of the map with the core of the Pilot’s value proposition and then works its way around each of the major surrounding dimensions of the solution.
Good conversations have developed when the teams are kept small; two-three person teams seem to allow for conversation and easy access to drawing on the map. The facilitator explains a section and each of the teams works to complete it. When most of the teams are finished, the group moves on.
In test trials, teams have been able to complete the map the space of an hour to 90 minutes. This brisk pace keeps teams from diving down into too much detail or getting stuck on one part of the solution. Because the remaining blank boxes or disputed content are easily visible, it is possible to promise that additional work and thinking can be applied afterward.
The scaling map is designed to be printed on a large page such as D sized architectural print. This allows it to be shared between two or three participants during a working session while still fitting easily on a standard table top.
Additional levels of development
With visual models, there is a tension between the level of detail captured in the model and the ease of its creation and use. For MECE models it is important to be complete, covering the entire domain, but still impossible to do this at a very fine-grained level of detail and have the model fit on one page.
As a result, we see a need for development of additional supporting tools. The scaling map was designed to support the needs of an initial assessment. Additional detailed work in each of the subject areas can be done with tools designed to dive more deeply into specific subject areas. For example, a service design blueprint or process flow model might be used to explore the logistics of service delivery, while a full-blown profit and loss budget sheet can be used to flesh out the details in the financials section.
We are currently identifying a series of the most useful tools that can be used to provide more detailed insights for each of the solution elements and would be happy to receive suggestions. In effect, the scaling map becomes the cover page for this collection of more detailed explorations.
Continuing evolution
This is a work in progress. We have been using and refining it as we work with various parties actively involved in the effort to Scale Up innovations in the humanitarian and development sectors. We are making it available now, not because it is fully finished, but because in keeping with a lean approach to innovation, the map would benefit from additional iterations and adjustments in more contexts.
To that end, the scaling Map is available under the Creative Commons General Use license. Revisions, improvements, and non-commercial uses are welcome. The authors would appreciate insights and suggestions for the continued evolution of the tool.
Sources
Disclaimer: The statements and opinions expressed in this article are those of the author(s) and do not necessarily reflect the positions of Thoughtworks.