
DevOps
How to collect, manage and visualize our log data? (part 2)

Application status, the content of http request and response, exception messages, etc., are all very useful for debugging online issues and monitoring applications, which has made collecting log data and visualizing log records as charts a necessity. In the past, we recorded log information into a log file. Then, we logged on to the server to check or download the log file. This made it very hard to analyze the log in real time, and difficult to search or filter logs by key words. Nowadays, as more and more services and systems are deployed in k8s (Kubernetes) clusters, finding new ways to collect and visualize logs data has become much easier. This article will introduce two k8s-supported log frameworks: ELK and EFK. In both cases, E stands for ElasticSearch engine and K for the application Kibana, used to visualize logs. L means logstash, the log agent. F is fluentd, a k8s Nodes-level log collecting application.
ELK (ElasticSearch logstash kibana)
ELK is a framework provided by Elastic stack organization that can be divided into three parts. The heart, ElasticSearch, is a data searching engine that can collect, provide and save data. It can be deployed onto k8s clusters and execute scaling automatically. Logstash is used to format log and send collecting data to ElasticSearch, like a pipeline. Kibana is used to visualize the data from ElasticSearch. You also need to set up a log collecting tool, beat (Filebeat), to collect the application log and send it to logstash.
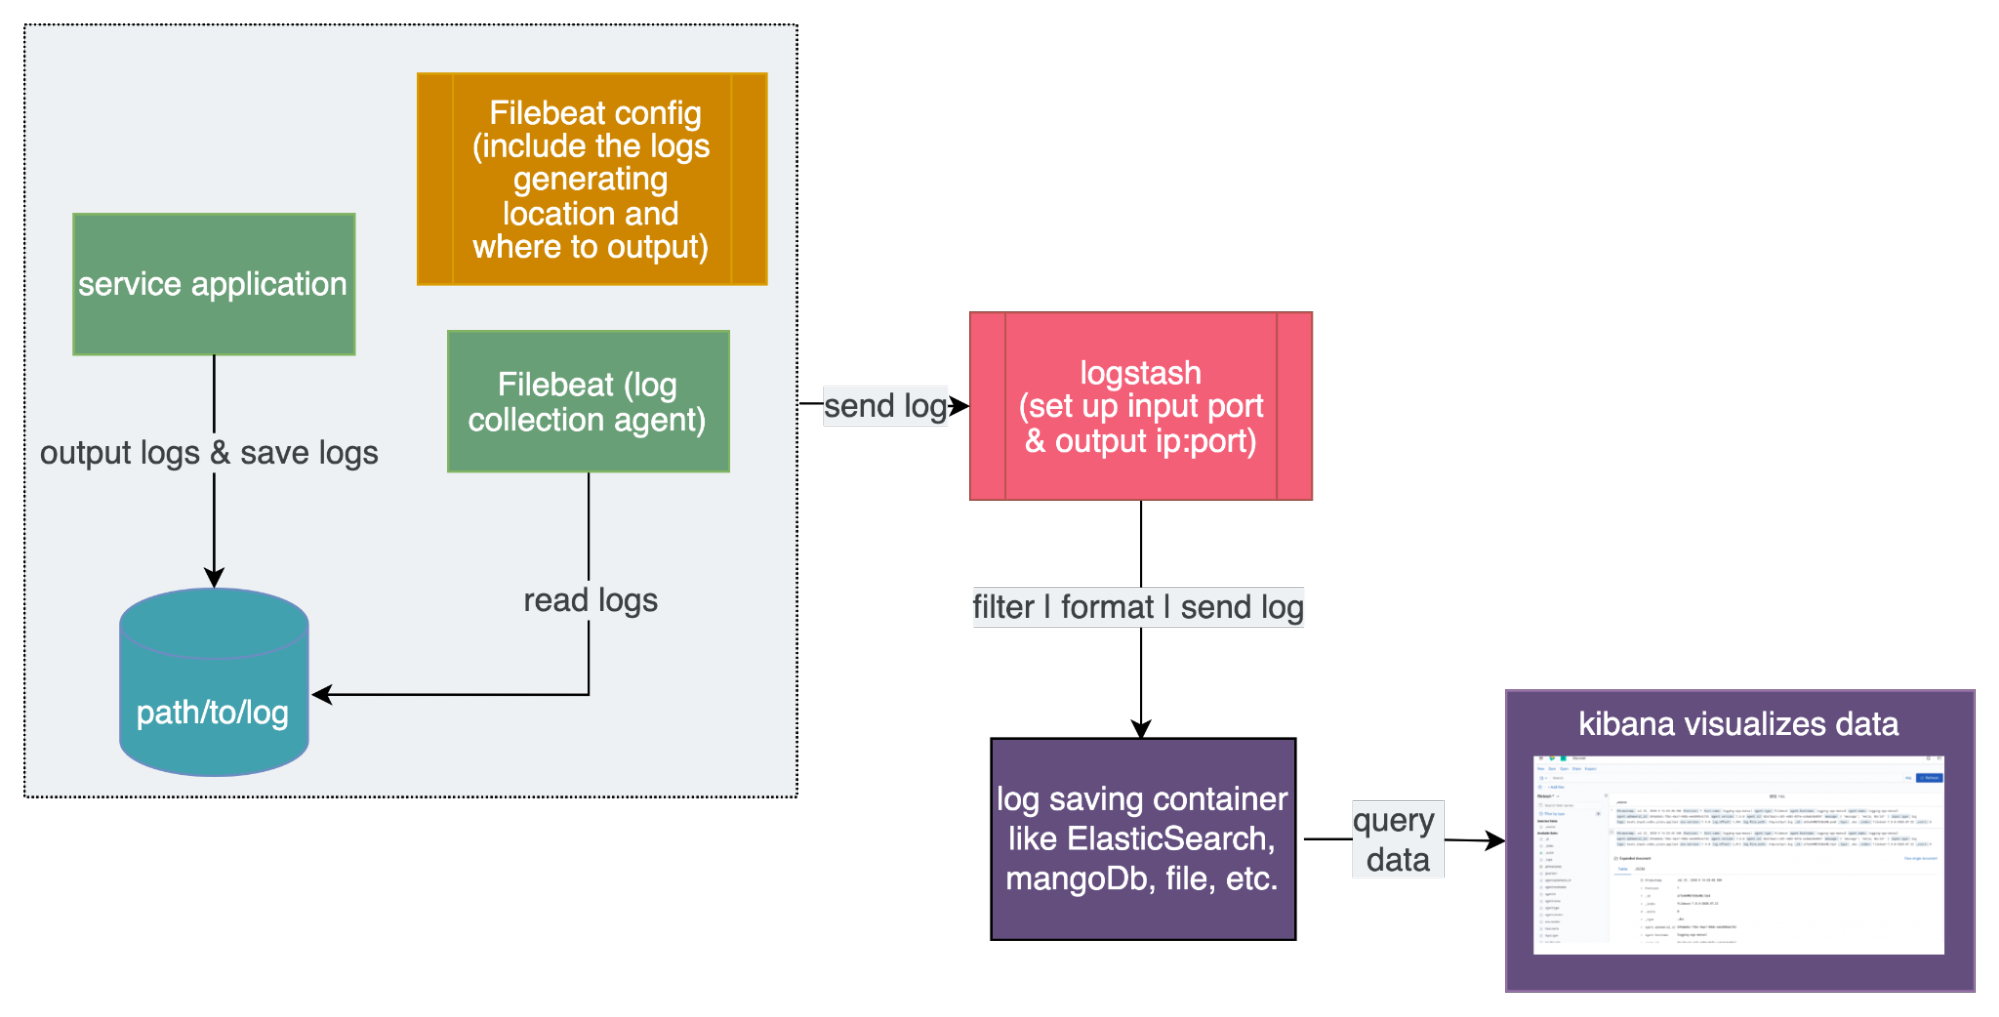
Workflow of ELK
EFK (ElasticSearch fluentd kibana)
EFK is another log framework; some of its features are similar to ELK. EFK includes a log agent and fluentd for collecting log data and sending log data to ElasticSearch. EFK supports two endpoints: Stackdriver Logging for use with Google Cloud Platform and ElasticSearch. Fluentd is deployed by DaemonSet k8s resource which can be further deployed into k8s Nodes as a Pod. These fluentd pods will collect the log of the pods in the same Nodes. EFK just needs to deploy ElasticSearch Pods, kibana interface Pods, and fluentd DaemonSet.
ELK
Deploy ElasticSearch engine in k8s
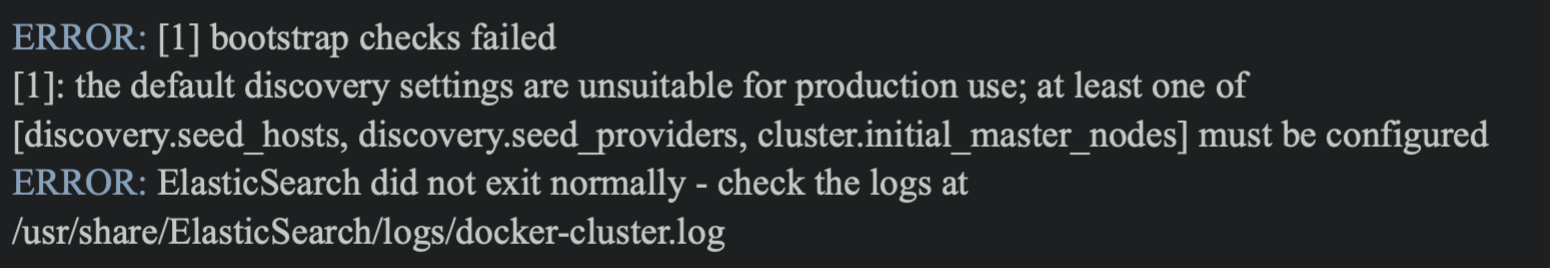
Add es-manual.yaml file, which includes k8s deployment configuration and service configuration. Service file is used to expose es-manual pod. Then other services can access theElasticSearch service freely. If you want to run es deployment in your local machine, you might specify that "discovery.type" is equal to "single-node". The default discovery.type for ElasticSearch is multi-node. If es was set as a multi-node cluster, it would discover other nodes. Therefore, some discovery configurations need to be set up. Otherwise, you will get the following errors.
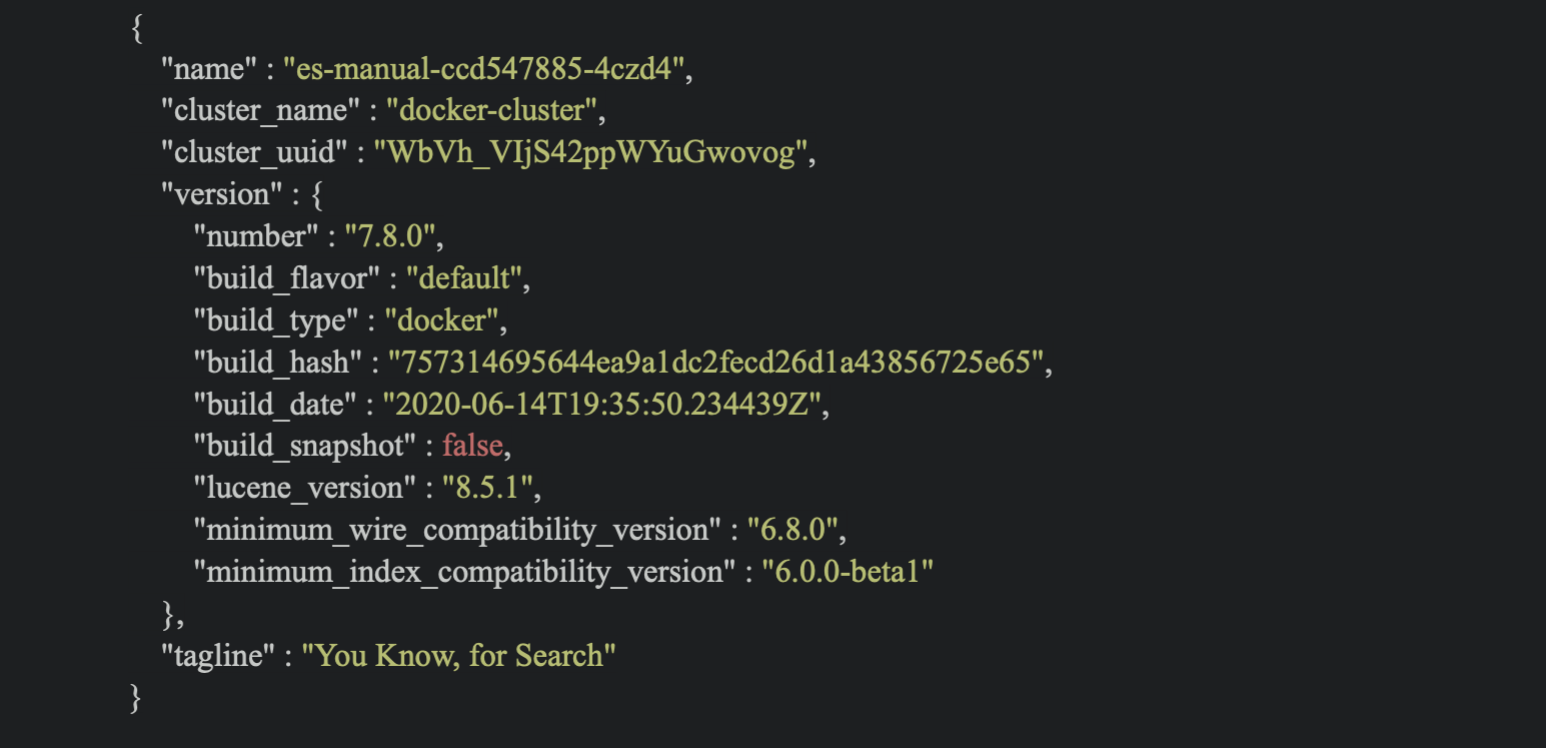
When es is set up correctly, you can input curl http://localhost:<expose port> in your iTerms and get the following:
Deploy kibana in k8s
Add a kibana deployment manifest that includes deployment image and service information. Meanwhile, the ElasticSearch exposes url should be added into k8s container as an environment variable like ElasticSearch_HOSTS. After successfully deploying, command curl http://localhost:32184/status can be used to check whether kibana is ready. What's more, you can also utilize the k8s service name as hostname with target port to communicate with es pods. When kibana runs up, you’ll see the following after accessing http://localhost:32184 on your browser:
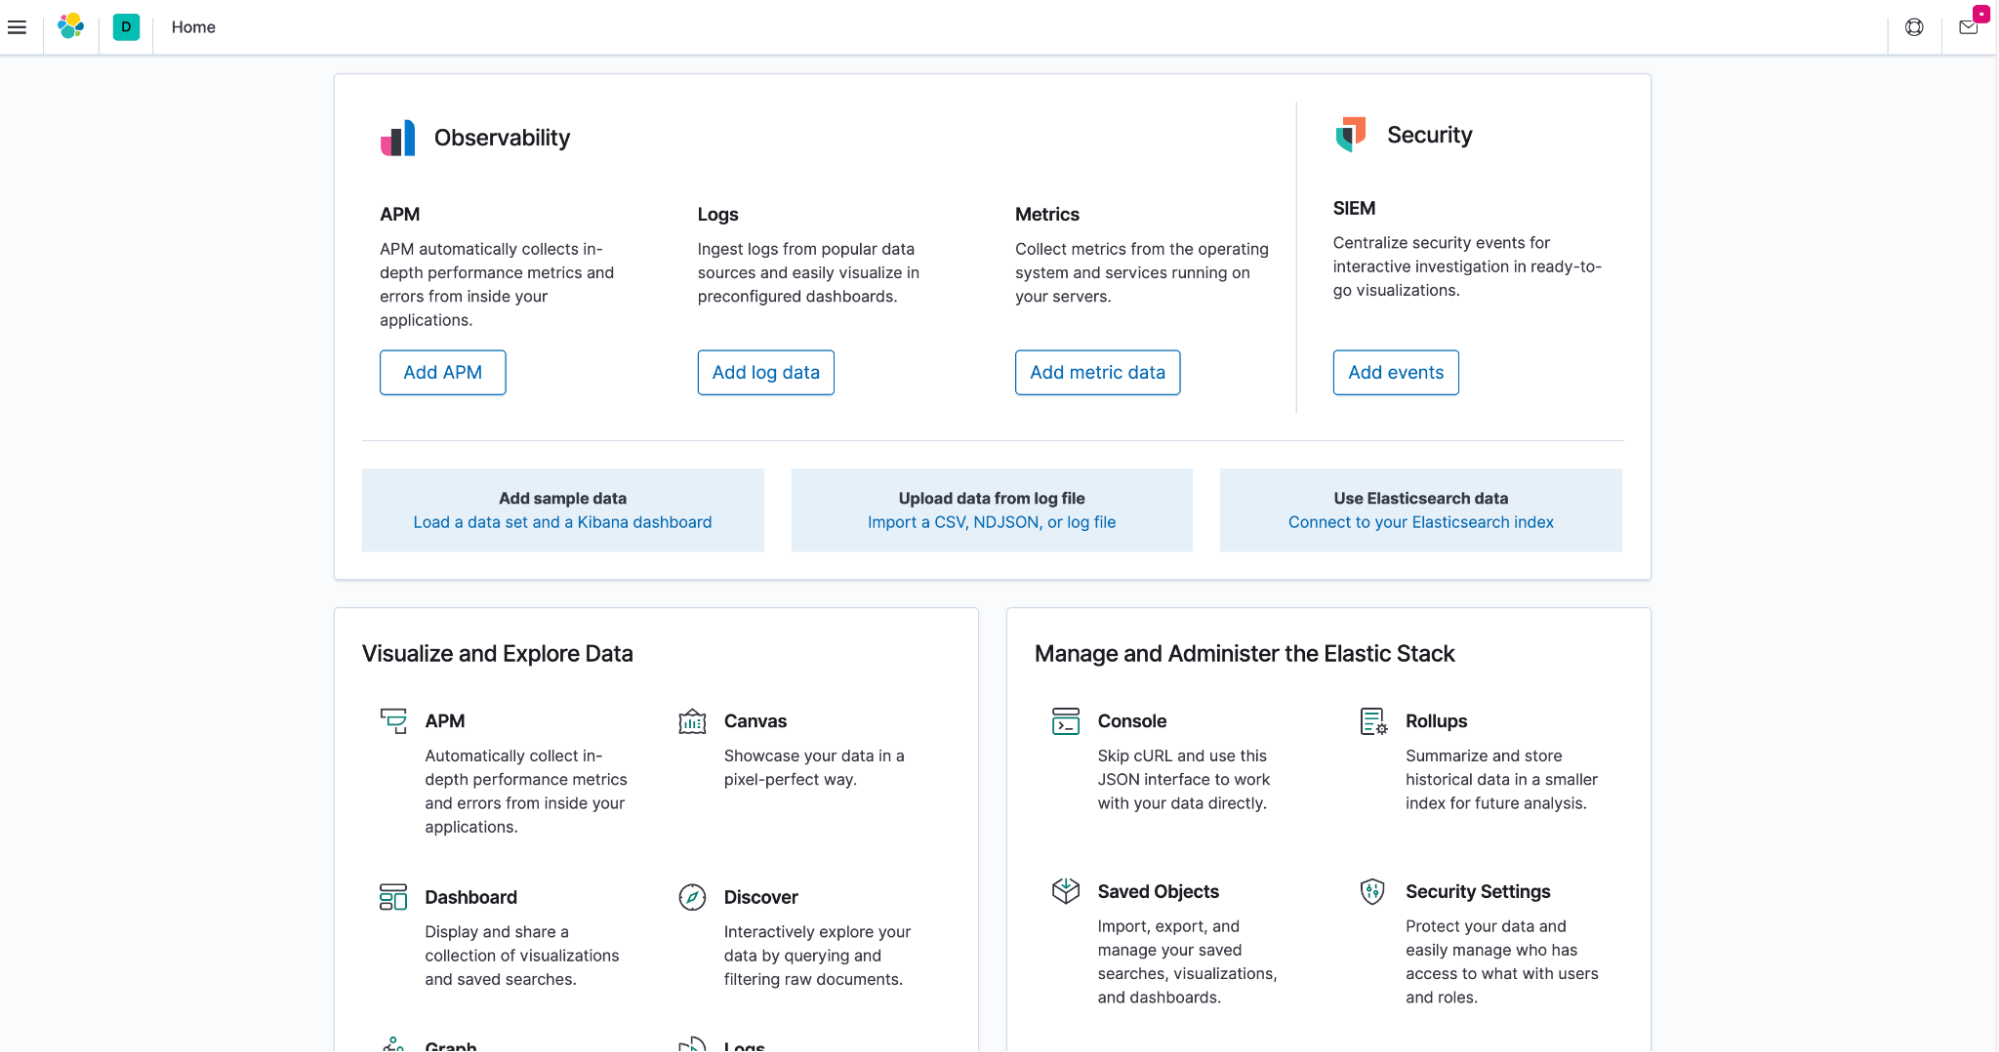
Console page for successful deployment of Kibana
Deploy logstash in k8s
Add logstash k8s manifest file and configuration file. Based on the first file, we can deploy logstash service in k8s cluster. In the second file, we will define the input and output of the data. logstash.config will be defined as a k8s configMap resource. Then deployment will volume the configMap into a k8s pod, which can be used by logstash service.
input the following command to create ConfigMap
kubectl create configmap logstash-config --from-file ./logstash.conf
create deployment
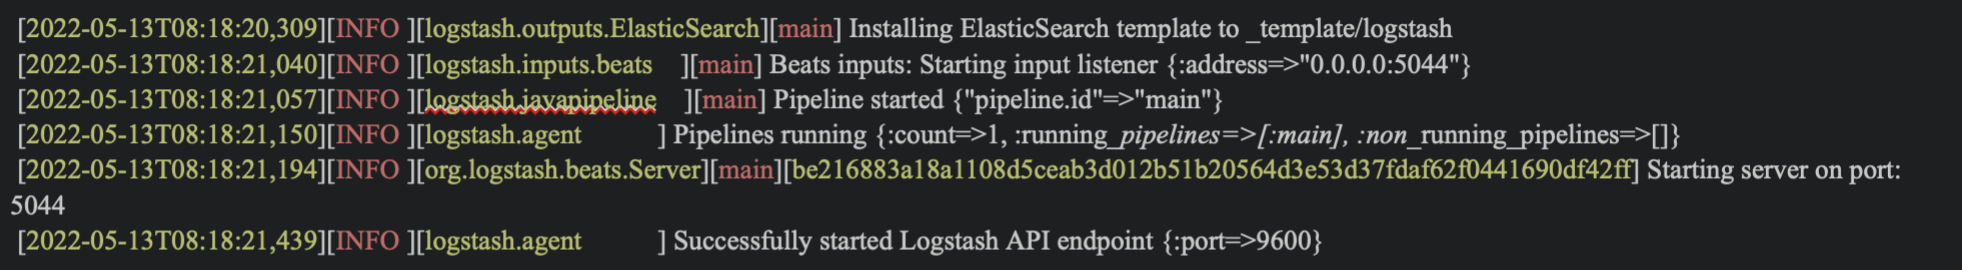
After logstash starts up, we can input kubectl logs <pods name> -f for obtaining useful log data.
Deploy Filebeat and Log generating application
In the end, we will deploy the log collector sidecar, Filebeat. It will collect log data from a sharing log file and send the data to the logstash. First, we need to define filebeat manifest, which will illustrate where filebeat reads log and where the log is sent. You can input the command to create configMaps for filebeat configuration kubectl create configmap file-beat-config --from-file ./filebeat.yml. Then this configuration will be volumed into pods when you deploy the log generator application and filebeat application. Then logstash will receive log data from being listened port. To check if the log system works, you can open your browser and input http://localhost:32184/. After creating an Index Pattern, you can visualize the log information.
To create "Index Pattern"
open kibana dashboard
click stack management
click index pattern
create new index pattern like filebeat*, index is defined in the logstash.conf file
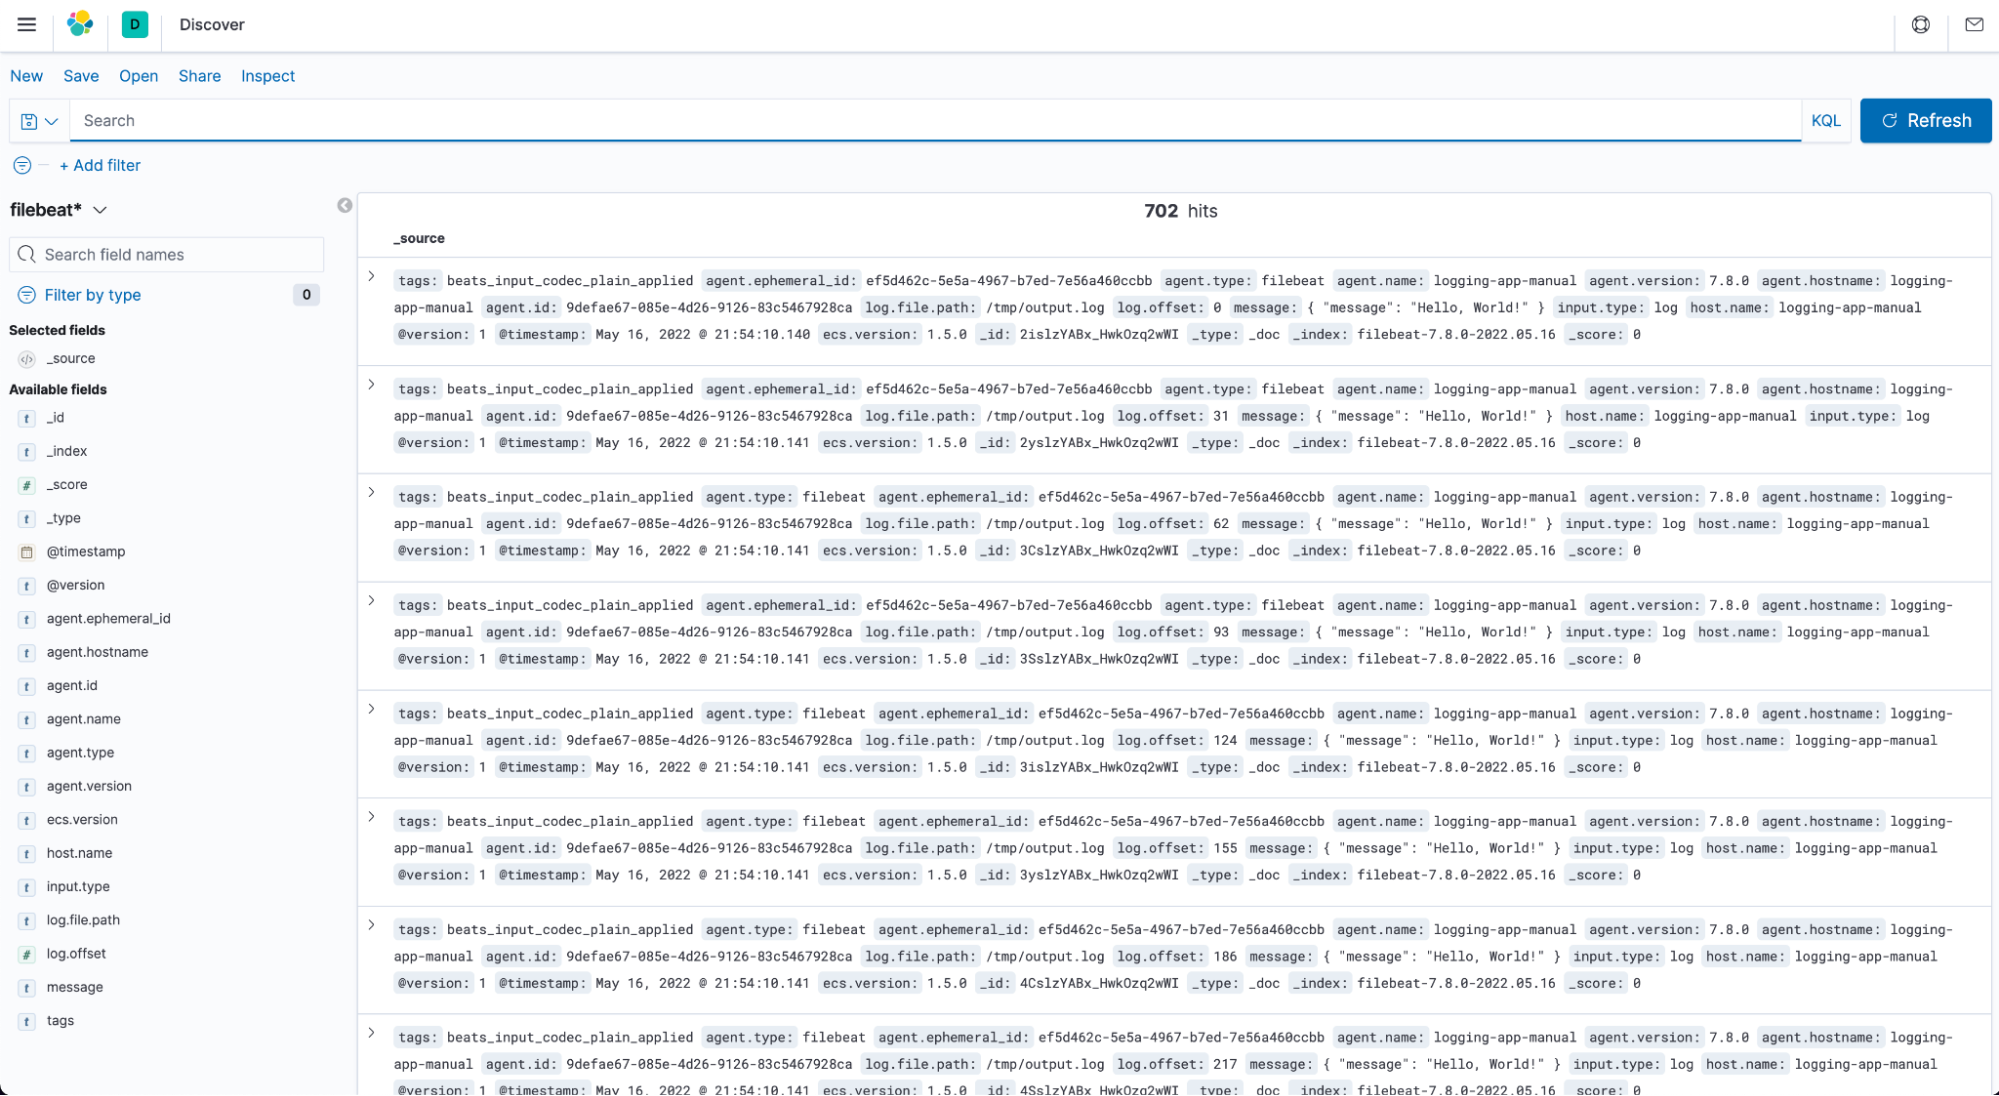
Query application log information from Kibana
We’ve learned how to create an ELK log system, the next article is going to focus on the EFK log system.
Disclaimer: The statements and opinions expressed in this article are those of the author(s) and do not necessarily reflect the positions of Thoughtworks.