


In a multi-team environment, rolling up data hides valuable information about progress toward objectives.
Great customer experiences require the coordination and cooperation of multiple teams. This is especially true of Agile projects that depend on delivering customer value rapidly, regularly and reliably. Such teams need to work together while retaining the unique processes that suit their individual contexts.
Even though business objectives may cross multiple teams, the complexity each team manages will significantly impact its process. It is also likely that the effort distributed across teams will vary from objective to objective. Rolling up data to calculate a single metric can hide this variation, giving misleading forecasts about progress toward objectives. Let's look at the example scenario below.
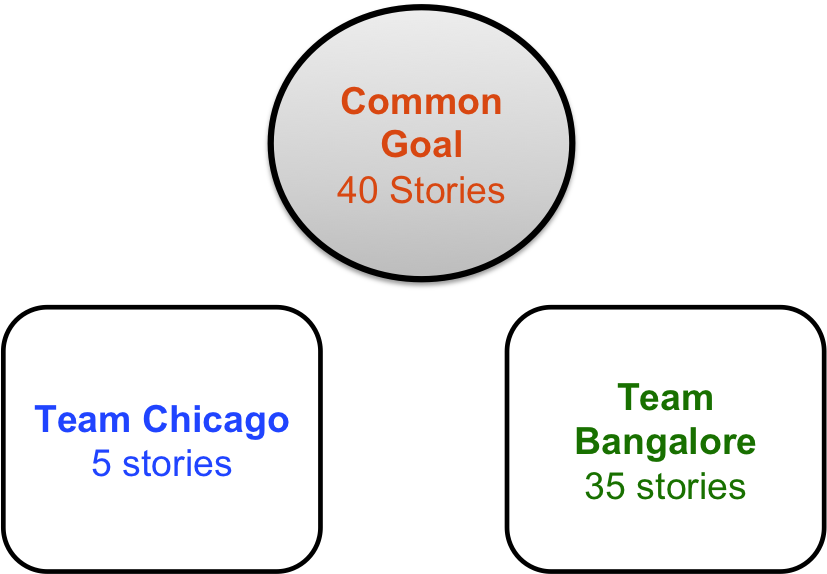
Common Scenario
Let’s look at the following scenario to understand how the distribution of effort influences the way we measure progress across multiple teams. Team Chicago and Team Bangalore are supporting a common goal, which has a total of 40 stories. Team Chicago is managing 5 of these stories and Team Bangalore is working on 35

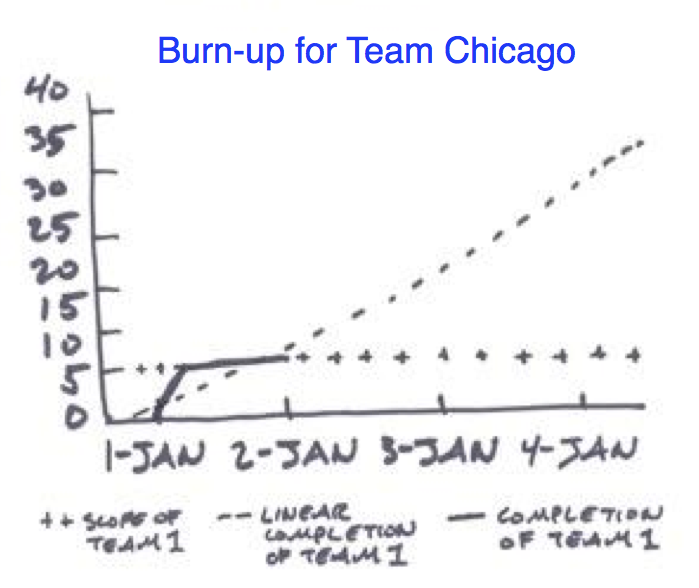
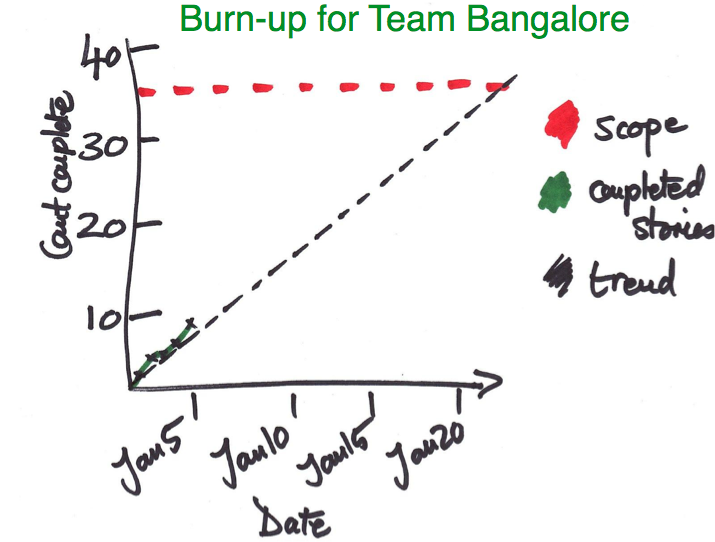
Analyzing the progress of the teams below:


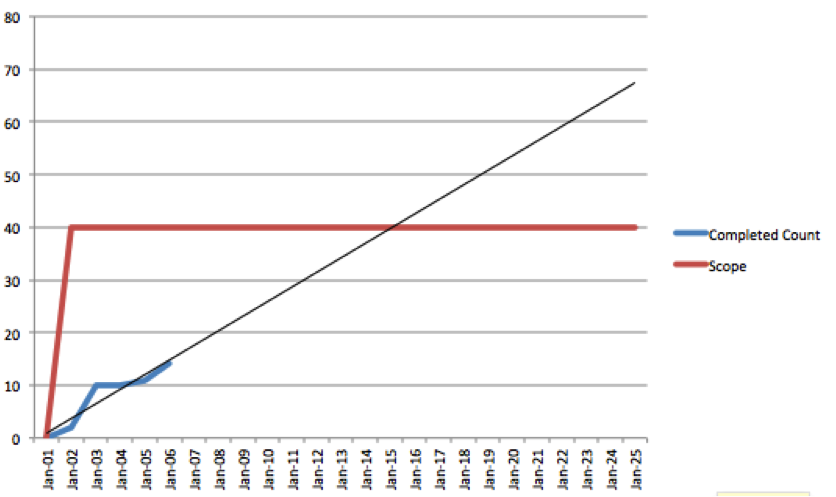
Incorrect Report of Program progress
Taking a look at the cumulative burn-up for the common goal involving the 2 teams, we see that the forecasted completion date is January 15, well before January 21 when Team Bangalore is likely to finish its work. Because the common goal cannot be completed until both teams finish their work, the business is constrained by Team Banglore's throughput, even if Team Chicago has already finished its work. Rolling up data, the cumulative burn-up generates an overly optimistic forecast, misleading the business about the reality of the situation. Looking at the individual burn-ups, however, provides the more accurate completion forecast of January 21.

- Alerts that indicate where attention is needed
- Project-specific progress bars and forecasting that do not mask information
- Forecasts with scope changes that provide information that can help guide decisions
Disclaimer: The statements and opinions expressed in this article are those of the author(s) and do not necessarily reflect the positions of Thoughtworks.