
APIs
Opentracing and Jaeger (part one)

In the first part of this article, we discussed how to use opentracing to solve some of the problems of distributed systems. Here, we’ll explore how using Jaeger can be a solution as well.
Introduction
Jaeger, inspired by Dapper and OpenZipkin, is a distributed tracing system released as open source by Uber Technologies. It is used to monitor and troubleshoot microservices-based distributed systems, including:
Distributed context propagation
Distributed transaction monitoring
Root cause analysis
Service dependency analysis
Performance / latency optimization
For more information, you can refer to Uber’s blog post, Evolving Distributed Tracing at Uber Engineering, or Yuri Shkuro’s book Mastering Distributed Tracing.
Architecture
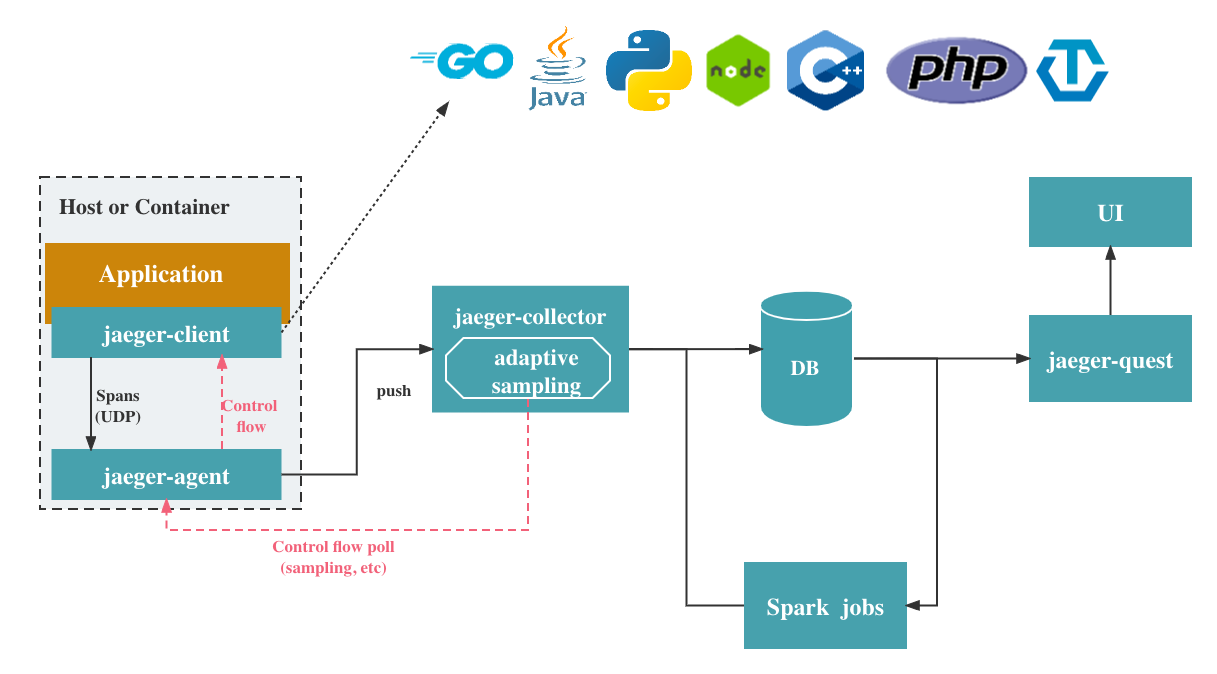
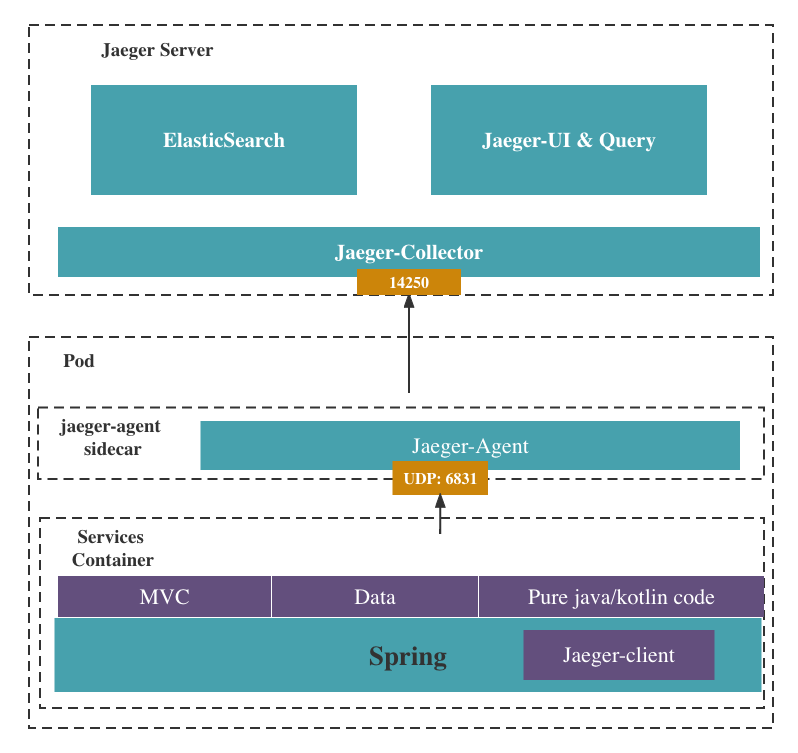
There are two main parts of Jaeger. The client part and the server part. The client part includes a client which is integrated in the application, and an agent which is used to transport the info collected by the client to the server.
The server has five components. The purpose of this part is to collect, classify and exhibit the data from all the Jaeger agents.
We can see that Jaeger has already implemented all components in Observability.
Architecture: client agent collector
First, let's take a look into the client agent and collector. Frameworks are already integrated with the Jaeger client. Most of these clients, like nginx and spring, use thrift/compact protocol to send the trace data to the agent. But there are also exceptions. For example, the node client uses the thrift binary protocol. What's more, the zipkin client is compatible with the Jaeger agent and collector, but it isn’t recommended by the official doc, and the api are also deprecated. For the agent, it uses grpc protocol to transport all the data to collectors. The grpc here can use round-robin load balancing or name resolution to connect to collectors.
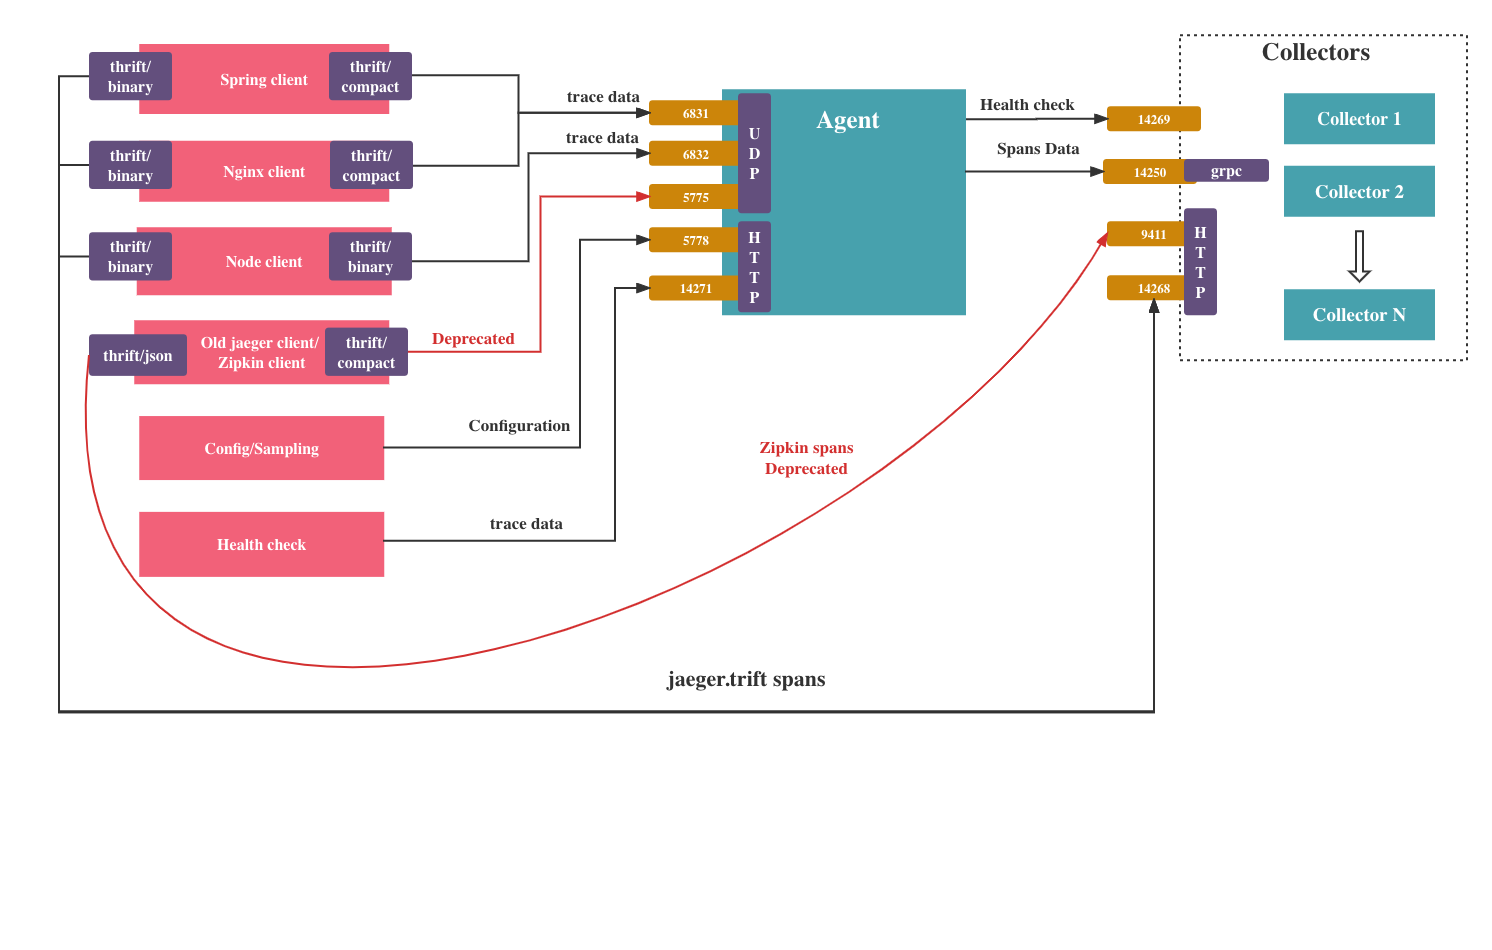
Architecture: client agent collector
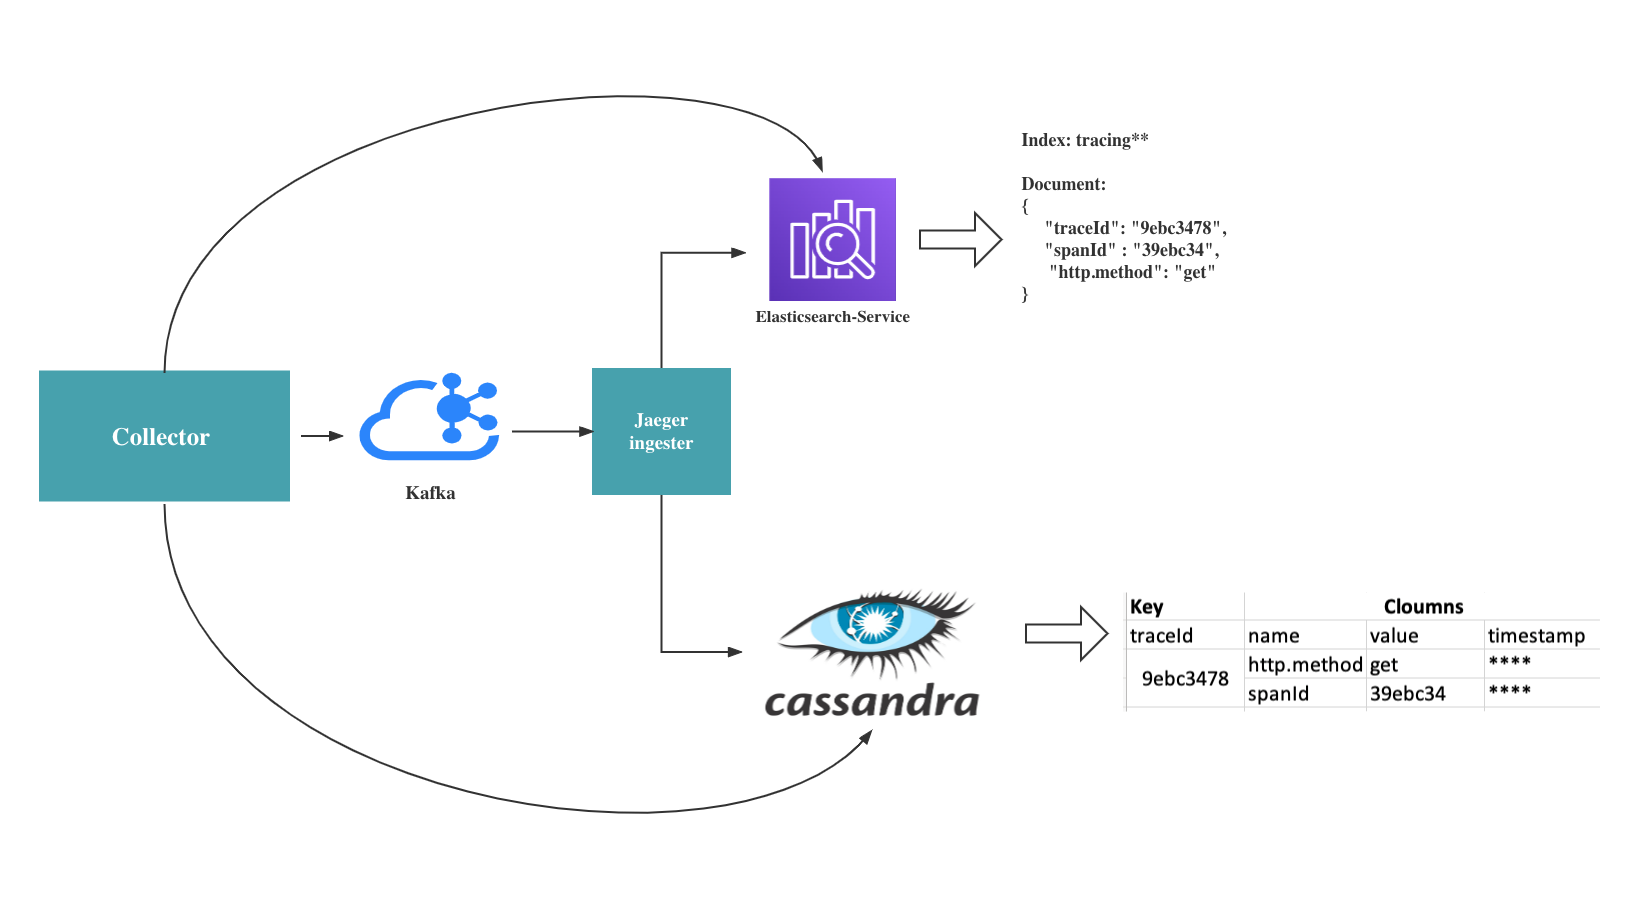
Based on Jaeger’s official documentation, there are two recommended tools to store the trace datas that are classified by collector. They are Elasticsearch and Cassandra. Elasticsearch is better than Cassandra because:
Cassandra doesn’t provide the same powerful search capabilities as Elasticsearch. Writing spans to Cassandra is actually an inefficient operation, because it will take a lot of time to do indexing work.
We can use kafka as a buffer to sort the span data.
Architecture: query and UI
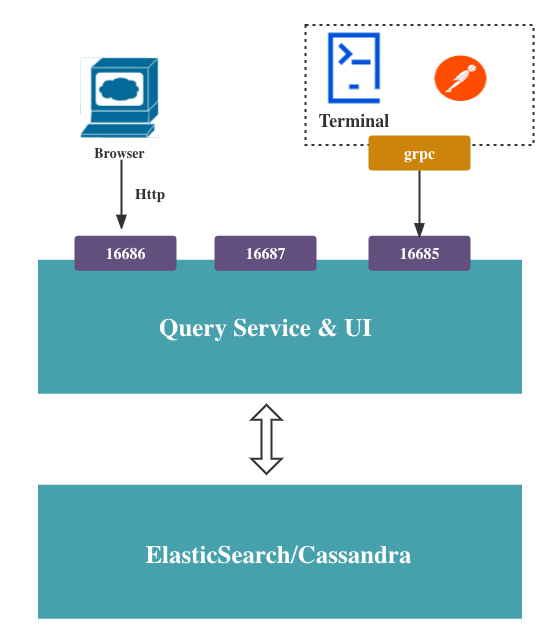
The last part is query service and UI. This component exposed three ports. One is used for Jaeger’s panel web page. One is a grpc protocol port. We can use command line or postman to query the trace data. The last one, of course, is a health check port.
Best practices
Based on Jaeger's offical doc, best practices should consider the long-term storage of trace data, scalability and high availability. Therefore they should cover the following features:
The agent is deployed as a sidecar of the microservice. The Jaeger client is already integrated into the service. The client will use udp protocol to send the tracing data to the agent. The sidecar deployment will reduce the pressure of transporting tracing data.
The UI, query, collector will be deployed independently, so that we can easily achieve scalability, high availability, and long-term storage targets.
Usage Jager Panel
This following picture shows a Jaeger panel. The left part is the search panel. We can see all the registered services, the operation filter, tags filter etc. The right side is the search result of all traces. The chart on the top right corner has two dimensions, one stands for duration of trace, the other stands for the timestamps of trace. Search results are listed in the bottom right corner.

Fancy features
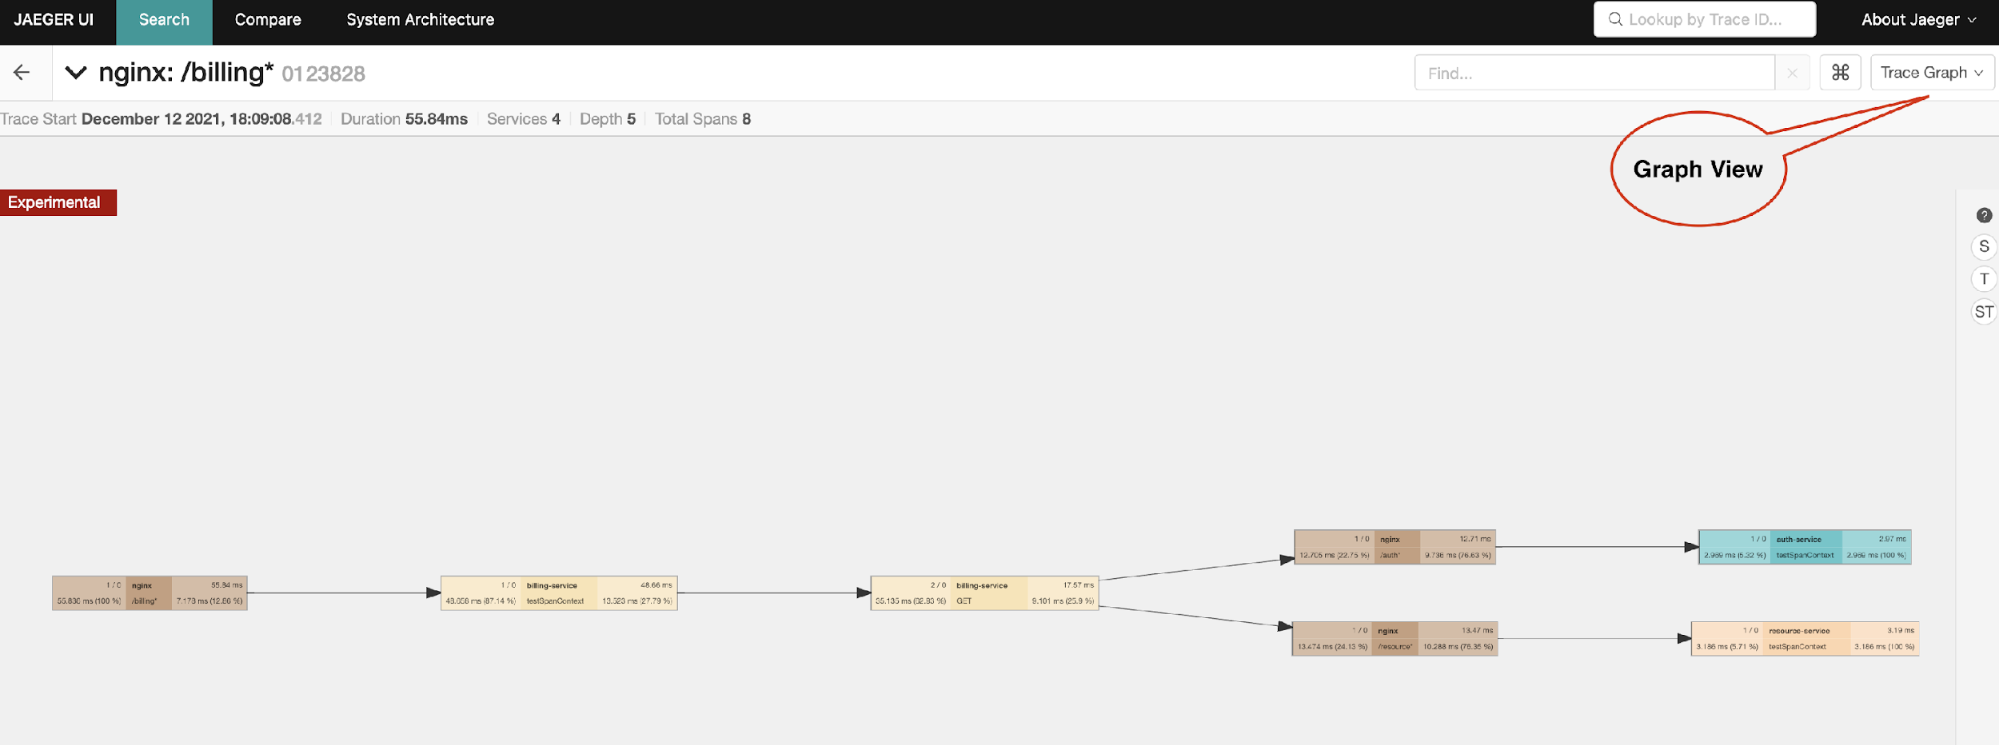
There are also some fancy features. For example, we can use a DAG (directed acyclic graph) to represent the spans’ causality. As this trace shows here, we can easily see the invoking relationships of each service.
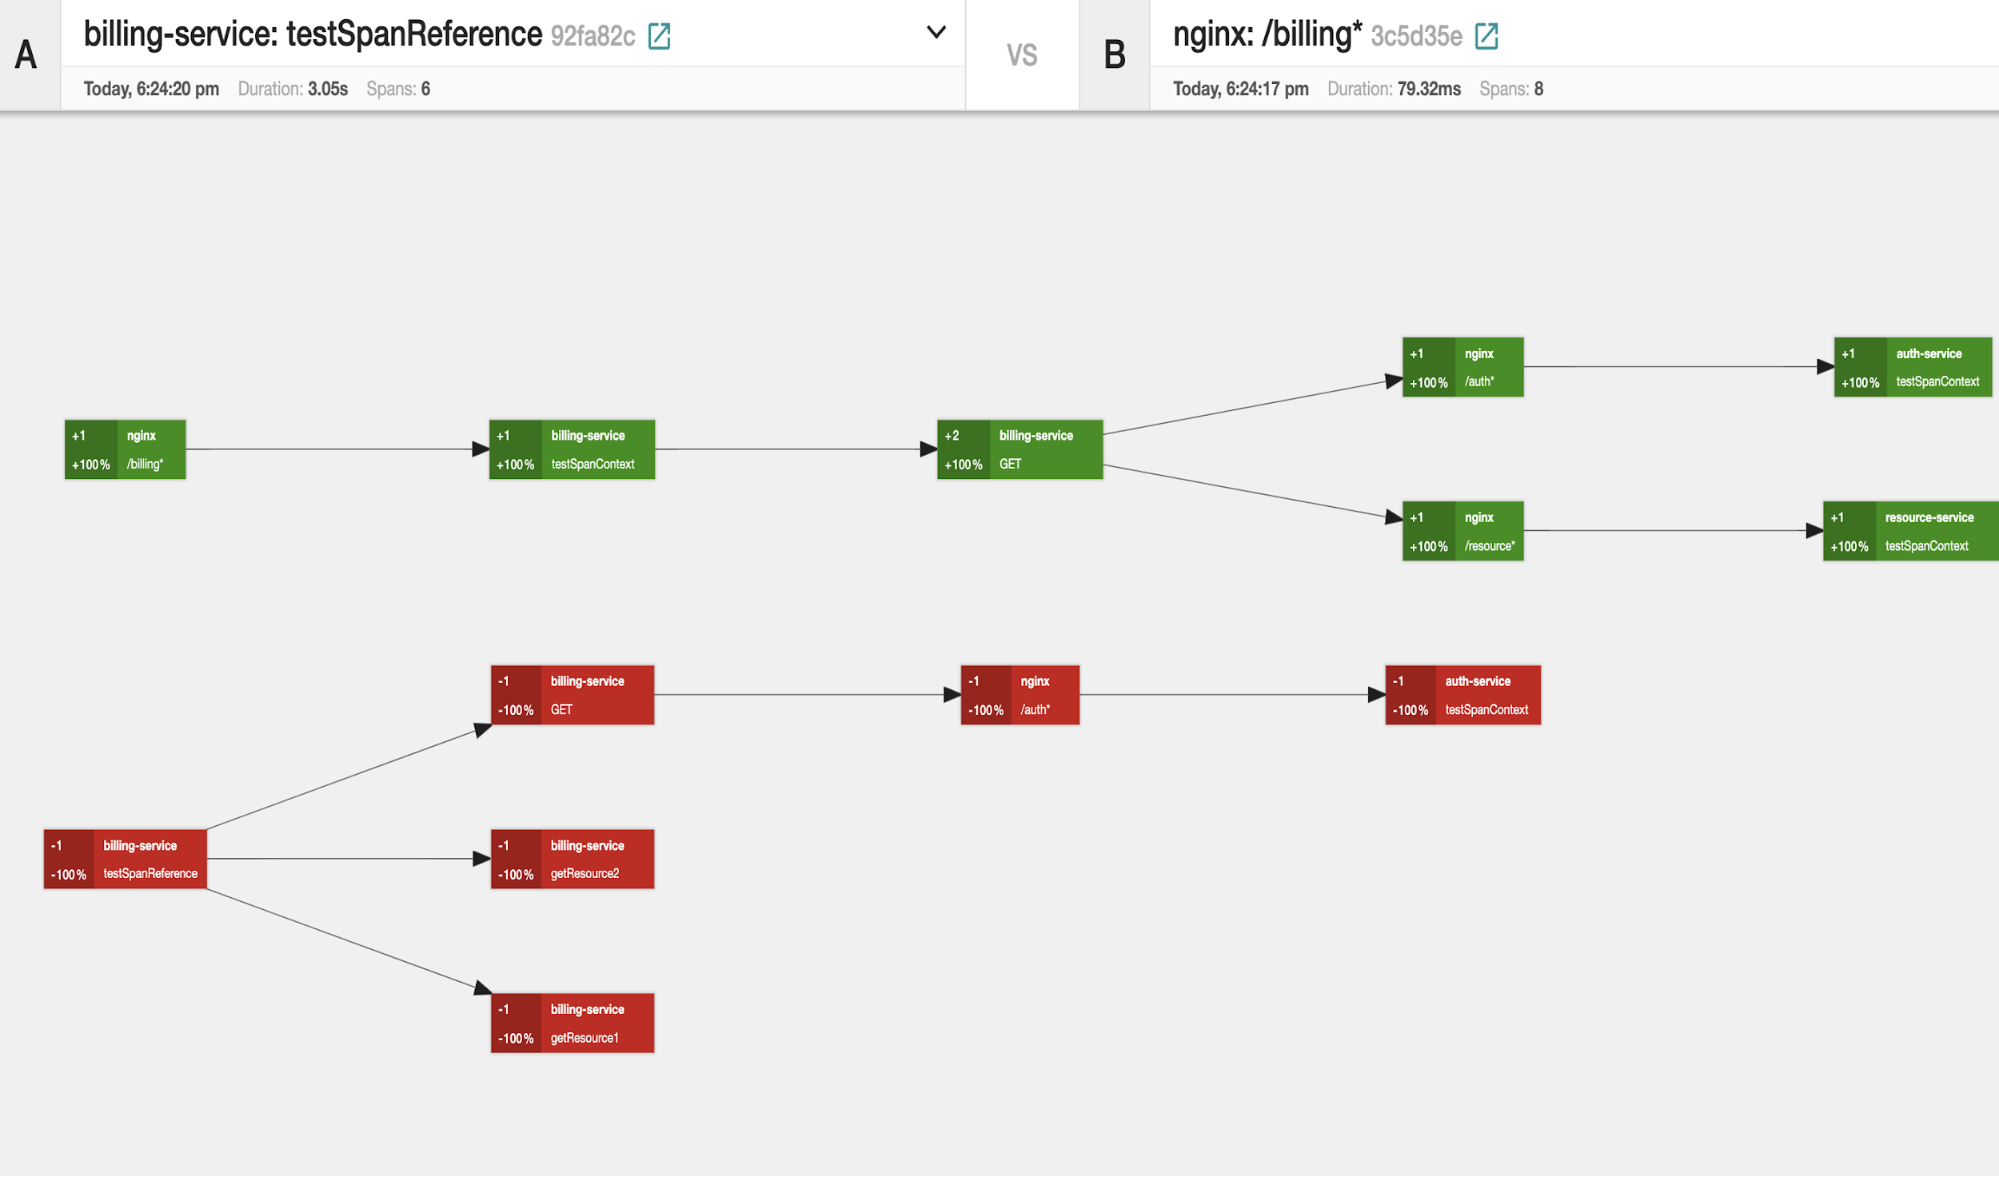
We can also compare the different traces. As we can see from the comparison result, the different spans of two traces are differentiated by using green or red.
This article gives some key points that would be very useful for developers:
Using Jaeger can help us observe the details of a distributed system, such as the time span, the call stack, etc.
Jaeger’s web panel provides many useful features, such as searching requests, comparing requests, etc.
Using the sidecar to deploy the Jaeger agent will reduce the pressure of transporting tracing data in the client part. This could be one best practice of integrating the Jaeger client in the service.
Using Elasticsearch to store the collected trace data is more efficient.
Disclaimer: The statements and opinions expressed in this article are those of the author(s) and do not necessarily reflect the positions of Thoughtworks.