


Sonar is a popular platform to manage code quality. This write-up details how to set up Go to do sonar analysis and then view the report from Go.
The write-up assumes that sonar maven plugin will be used to do analysis.
Let us start by having a pipeline with two stages, “build” and “test”.
Set up a new stage "quality".
Add a new job “sonar”
Add a new “Custom Command”

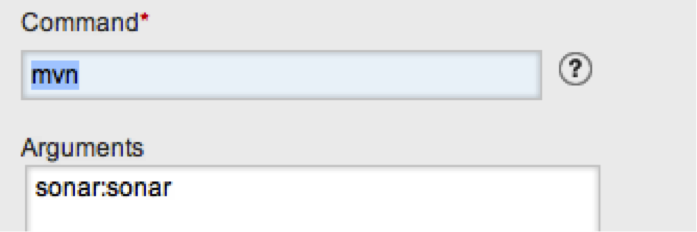
We will now have something like this:

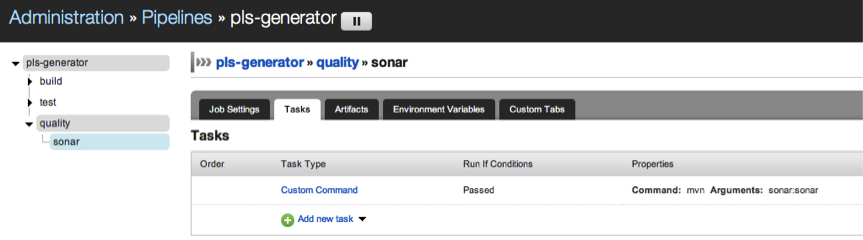
This will ensure that once the code is built and unit tests are run, a quality analysis is run using sonar. The report is available in the sonar dashboard below.

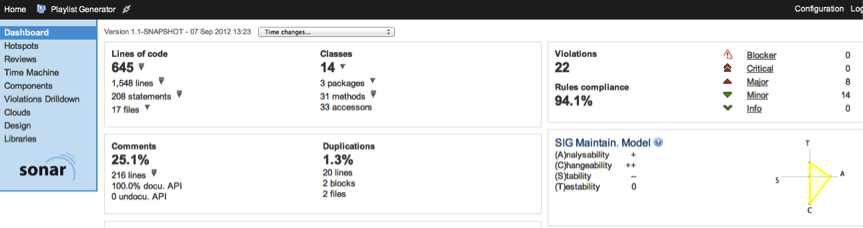
Wouldn’t it be better if we could view this from within Go itself? To achieve, this we need to do a couple of steps more.
Create a file, say sonar.html which has the following contents
<meta http-equiv="refresh" content="1;url=http://localhost:9000/dashboard/index/2368"/>
Essentially this is a redirect to the url of the sonar dashboard for the specified project. This file can be created by a separate task. Alternately, we can add this file to the project repository, say in “src/main/config”
Assuming the later, add this file as an artifact to the “quality” stage.

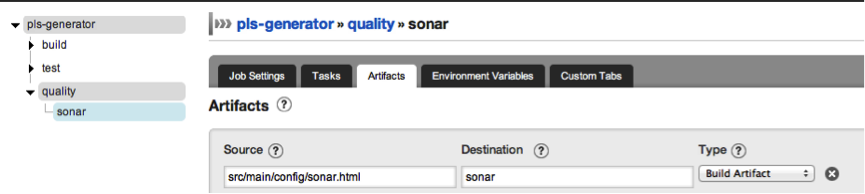
We have asked Go to copy the file “sonar.html” from the system (Go Agent) that runs the job to the Go server.
Now add a custom ta

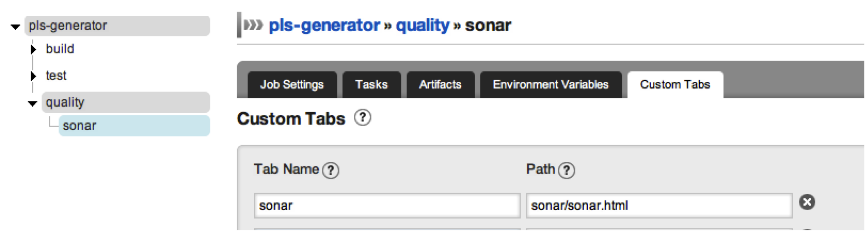
This tells Go add a new tab for the “quality” stage to display the sonar dashboard. We are telling Go to open the page sonar.html, which will redirect to the Sonar dashboard thanks to the meta refresh that we have therein.
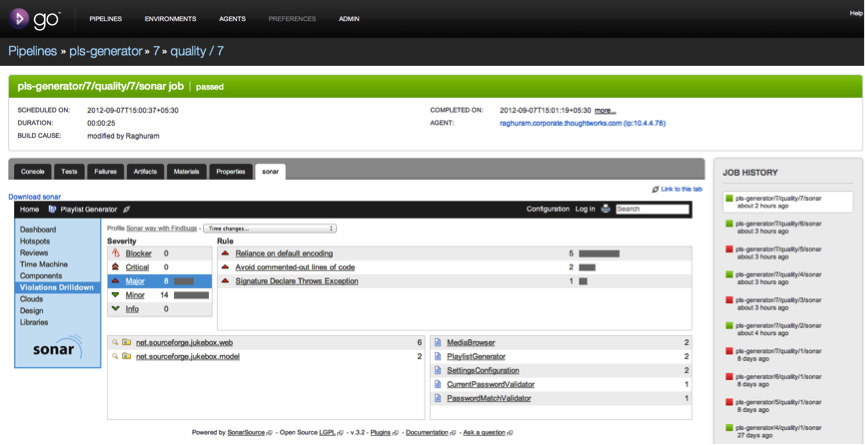
And thus,

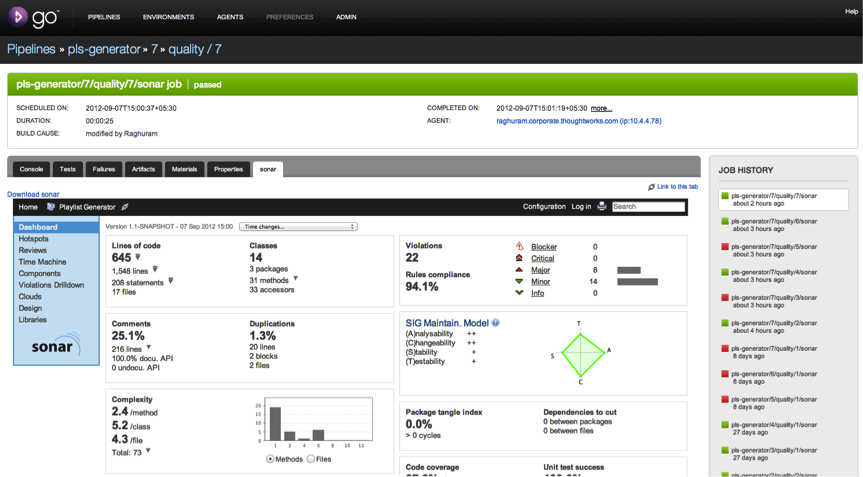
We can now drill down into the sonar dashboard from within Go.

Disclaimer: The statements and opinions expressed in this article are those of the author(s) and do not necessarily reflect the positions of Thoughtworks.