


In Part 1 of our blog series on Monitoring the Build System, we walked through the challenges we faced and the ways we resolved them. In this blog, I'll discuss further details regarding our build system and the tools that we used.
Consider this build tool workflow:

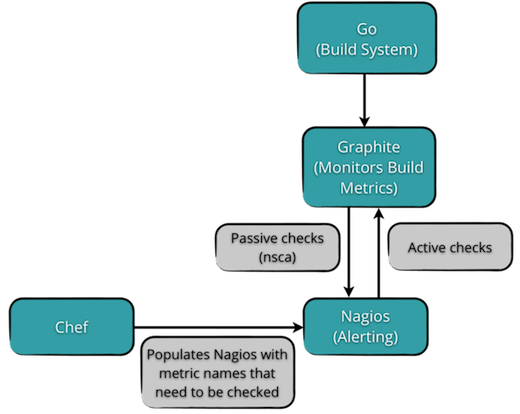
Workflow Steps
- Collect metrics from Go and send them to the monitoring tool.
- Capture these in Graphite (our monitoring tool).
- Use Nagios to send out alerts based on discrepancies in the build, through a combination of active and passive checks.
- Finally use Chef to populate Nagios with metric names that need checking.
Let’s look at each of these points in further detail:
- Collect metrics from Go - Go has XML feeds that help you obtain the metrics related to each pipeline, each stage and each job. It also allows you to check the build time, wait time, time for a VM take to checkout a Git repository, etc.
Using these APIs and XML scraping, we were able to emit the values to Graphite. We used a combination of Ruby scripts with Nokogiri to publish these metrics to Graphite. We added checkpoints to the XMLs to ensure that at every hour we start with the new set of XMLs that correspond to the builds that have run in the last hour. A couple of passionate developers helped us out with this effort. They also took care of edge-case conditions such as storing metrics locally if Graphite was down, and then at a later stage, publish them directly to Graphite. We pump the data once every hour for reasons discussed in the previous post.
-
Monitor using Graphite - We've been using Graphite for a while now and are very happy with it due to its metrics reporting capabilities. You can easily see your time series data. Provide Graphite (using Netcat or any other tool) data in the following format: <Metric Name> <Value> <Timestamp in Epoch> and it plots it for you. It also has the ability to stack up multiple metrics together in the same view.
Graphite is scalable too. For example, in our case, comparing the same job across 2 branches in the same graph gave us insight into the time the job took across multiple pipelines (branches). If there is a huge discrepancy, then you know that the job time has deteriorated either due to code or infrastructure. I've put up some material on how to get started with Graphite and debugging here. We started with monitoring the run times and wait times of each of the jobs along with job failures and successes. For each of these jobs (i.e. for any metric that starts with “Build.Metrics.*”), we maintain one data point for every 5 minutes for a period of 1 year. It is important to make this calculation, lest you end up with either too many or too few data points in Graphite.
-
Alerting with Nagios - Since we have roughly around 500 metrics (With 15 pipelines, 3 branches and 5 -40 compile jobs!) to monitor from Graphite alone, it is almost impossible for anyone to monitor these only in the GUI as there is a high risk that you would miss out on alerts. Nagios has a very mature alerting system, so we decided to use that. Here is what we have done:
- Divided the checks into passive and active.
- Active checks generally run as NRPE checks but we didn’t use that as we query the Graphite API directly to get the values. For active checks, we use wildcards that Graphite supports . For example, if I want to monitor wait times across 100 jobs, I can just monitor “BuildMetrics.*.waittimes” where “*” stands for the actual build metric name and I get the wait times for all 100 jobs in JSON format. Then iterate over these values and get alerts based on them. We used this approach for all the wait times of all jobs.
- Passive checks - Run times per individual job are unique and we wanted to keep them separate. So we used nsca, a tool that comes with Nagios, to send out alerts passively to Nagios from the Graphite box.
- You may be wondering about the source of the warning and critical values for each job based on which Nagios will send out alerts. If so, then you're definitely on the right track! This is a one-time activity that we perform for each branch. After 6-7 runs, we run a script that gets the average of all jobs and based on that we’ve configured Nagios to alert the required people every time it crosses X% of the average job value.
-
Using Chef to pump in the metric names in Nagios - For Nagios to issue alerts, it needs to be told what metrics it has to monitor. We've been using Chef in our environment since the start of the year and we used Chef yet again to automate the Nagios metric name insertion. We run a script to generate the metric names for a particular branch and using Chef templates (templates in chef are .erb files where you can run some ruby code), we populate Nagios configuration files. With all these in place and a Mail Server configured, you're assured of getting alerts.
We've had this system in place for a few weeks and we've already ironed out some problems and have found issues that we didn't think were there with the Build System.
I would like to thank Hemanth Yajimala, Karthikeyan Thangavel, Sriram Narayanan, Rohith Rajagopal for helping us out.
Comments and thoughts around this are welcome!
Disclaimer: The statements and opinions expressed in this article are those of the author(s) and do not necessarily reflect the positions of Thoughtworks.