
Generative AI
AI evals for MCP in AIOps

Observability is shifting fast. As systems spread across Kubernetes, serverless and managed services, telemetry grows but context gets harder to find. Static thresholds, siloed tools and per-metric alerts create noise, slow root cause analysis (RCA) and burn out ops teams.
This blog post shares how we used Datadog on AWS EKS to move from reactive firefighting to proactive, AI-driven monitoring. We’ll cover monitors-as-code, unified tagging, chaos validation and alert designs that tie technical anomalies to real business impact — cutting alert noise by 80% and mean time to restore (MTTR) by 50%.
Our client, a global leader in manufacturing, was operating with an observability platform that had grown noisy, fragmented and reactive. Instead of surfacing meaningful insights, it generated a flood of alerts — many irrelevant, redundant or misleading — such as:
False positives: benign events like brief CPU spikes were flagged as critical.
Non-actionable alerts: predictable, low-risk conditions such as scheduled maintenance.
Duplicate alerts: multiple notifications tied to the same root cause.
Flapping alerts: unstable OK/ALERT state changes creating noise.
Poor thresholds: static triggers on harmless fluctuations, ignoring seasonality and business context.
| Error example | Why it’s faulty |
| 5xx error rate > 1% | A static threshold fired during low-traffic periods or on non-critical services, generating noise without reflecting a genuine issue. |
| Disk usage > 80% | On high-capacity disks, this threshold triggered long before space constraints posed any real risk, prompting unnecessary investigation. |
| Checkout service latency > 200ms (p99) | Temporary spikes from normal traffic patterns caused alerts without any actual degradation in user experience, creating false urgency. |
The result was classic alert fatigue: high volumes with little prioritization, which overwhelmed operations teams. This constant noise slowed RCA, increased manual troubleshooting and obscured critical issues. The downstream impact was severe — delayed order processing, frequent peak-time interventions and growing operational strain that ultimately hurt both customer experience and business performance.
The limitations of the existing platform made clear the need for a unified, intelligent observability solution that could cut noise, add context and provide end-to-end visibility across a modern, distributed environment.
Datadog was selected for its ability to directly address these gaps and enable a shift from reactive firefighting to proactive operations.
Unified platform. A single pane of glass for metrics, logs and traces, eliminating tool-hopping and accelerating RCA.
AI-powered monitoring. Built-in anomaly detection and dynamic thresholds to reduce noise from static, per-metric alerts.
End-to-end visibility:.Seamless integration with EKS, AWS services (RDS, SQS, Lambda) and custom applications for full-stack context.
Business–technical correlation. Ability to ingest custom business metrics and link them with technical signals, making alerts meaningful in business terms.
Datadog’s combination of breadth, depth and AI capabilities made it a fit not just for replacing the old platform, but for enabling the proactive, business-aware observability model the client needed.
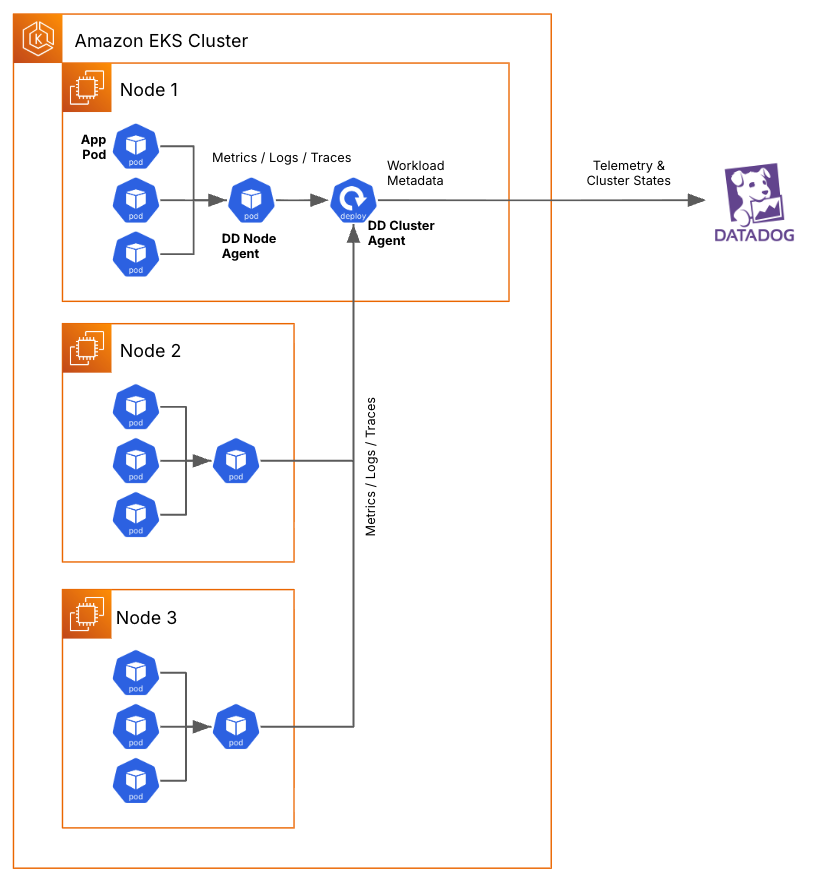
The project aimed to rebuild observability (Figure 1) on AWS EKS using Datadog’s AI-powered capabilities — transforming operations from reactive incident handling to proactive, business-aware monitoring.
We approached the transformation in two deliberate phases. Phase 1 was about getting the foundations right—creating a consistent, scalable observability stack across services and environments. Phase 2 built on that foundation, layering in richer business context, deeper integrations, and AI-driven capabilities to make monitoring proactive rather than reactive.
During phase 1, we focused on building five core capabilities that would serve as the backbone for all future observability and AIOps work:
| Capability | Description |
| Unified telemetry collection | Consistent, automated instrumentation for metrics, logs and traces across all services. |
| Baseline performance visibility | Standardized service-level and infrastructure-wide dashboards anchored in RED metrics. |
| Monitors as code | An infrastructure-as-code approach to alert definitions for repeatability and version control. |
| Alert automation | CI/CD pipelines to deploy, update and validate monitors across environments without drift. |
| Resilience validation | Chaos engineering to prove dashboards and alerts behave correctly under real failure conditions. |
We deployed Datadog Agents and the Datadog Admission Controller across a shared EKS cluster, ensuring all services were automatically instrumented for metrics, logs and traces. Unified service tagging was enforced from day one so every signal — whether from infrastructure, an application or a custom metric — could be filtered, correlated and queried consistently across environments.
We adopted the RED framework (requests, errors, duration) as a consistent baseline for monitoring application health. Every service received a standard dashboard template showing its RED metrics, while a Kubernetes-wide infrastructure dashboard gave teams a single view of cluster health. This created a shared performance language across development, operations and business teams.
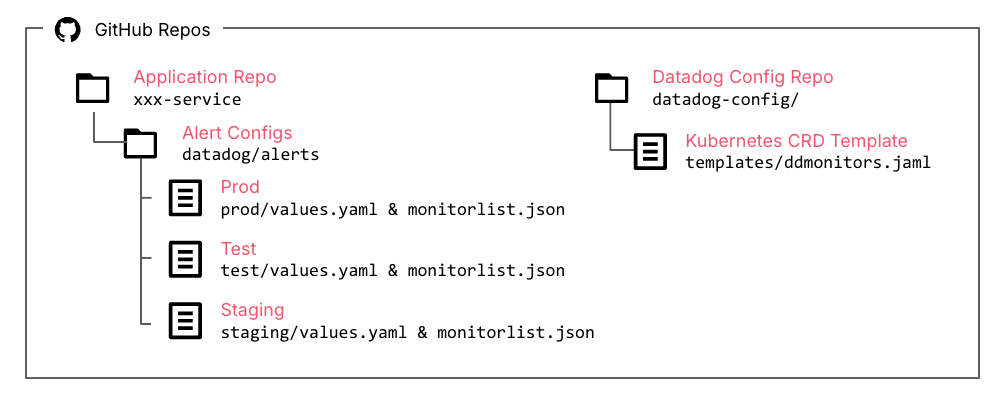
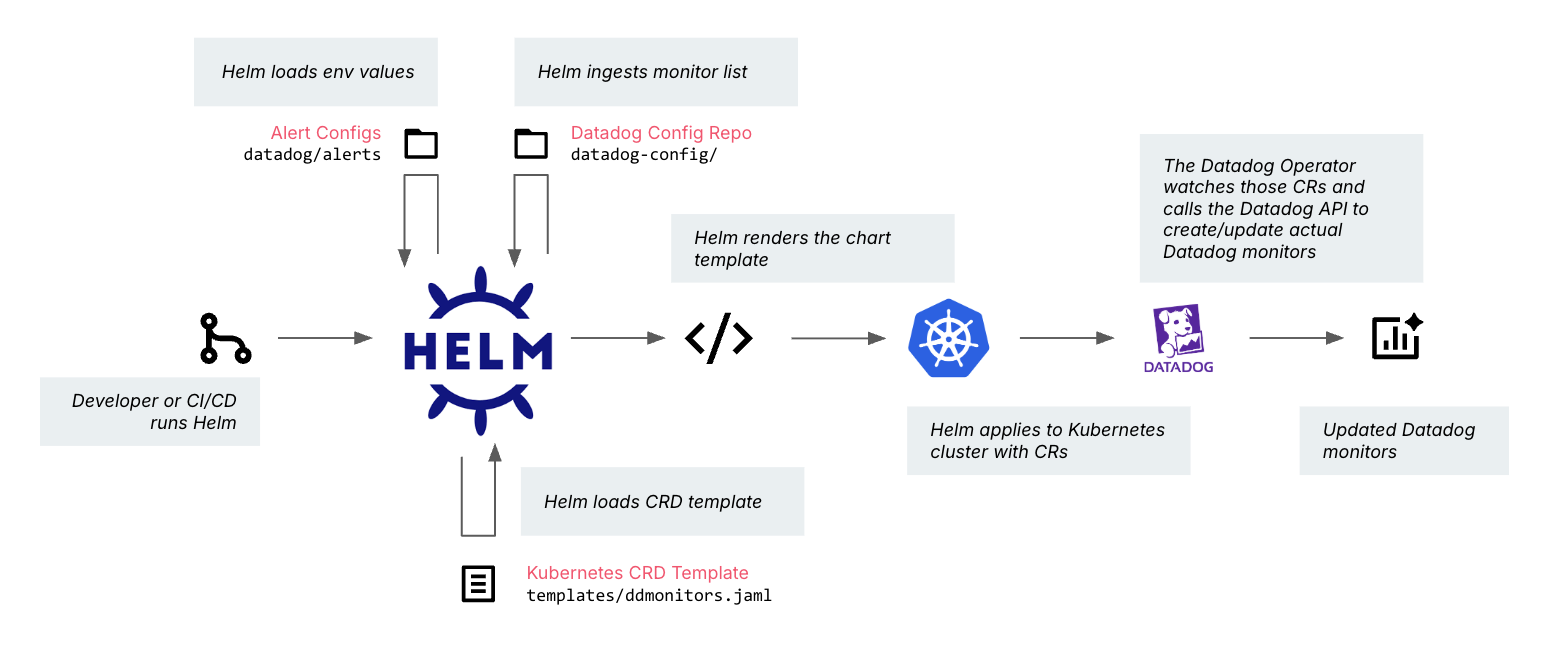
Alert definitions were expressed as Kubernetes Custom Resources (CRDs), allowing monitors to be versioned, reviewed and managed like any other piece of code. Environment-specific metadata — such as thresholds or service IDs — was stored as JSON in GitHub (Figure 2.), ensuring configurations were explicit and easy to change.
We built GitHub Actions pipelines to deploy and update monitors automatically in all environments. This eliminated configuration drift, sped up onboarding for new services and made monitor changes as fast and reliable as a code deployment.
Before go-live, we ran targeted chaos engineering experiments — intentionally introducing faults into microservices to verify whether dashboards lit up correctly and alerts fired at the right time. This step gave the team confidence that the monitoring stack was trustworthy before it was depended on in production.
The goal of this phase was to extend the platform’s capabilities with deeper integrations and advanced features to enable AIOps use cases. With the foundational telemetry, tagging and monitors-as-code already in place, we could now focus on connecting more systems, enriching the data model with business context, and applying intelligence to move from reactive monitoring to proactive incident prevention.
We enabled native Datadog integrations with key AWS services critical to the client’s order processing and application workloads:
Amazon RDS: Surfacing slow queries, connection limits and performance bottlenecks.
Amazon SQS: Monitoring queue depth, processing rates and error handling.
AWS Lambda: Tracking cold starts, execution timeouts and business error codes.
Each integration came with a dedicated dashboard, allowing engineers to troubleshoot across both containerized workloads in EKS and managed AWS services without switching tools.
With AWS integrations in place, we could now start closing the gap between technical signals and business impact.
Business metric monitoring. The first step was to capture business metrics directly from traces and logs — order creation counts, error code occurrences and other key events that define operational success. This meant alerts could now fire when there was a meaningful drop in successful orders, not just when a technical threshold was crossed.
Trace-driven root cause analysis. Root cause analysis also became faster and more precise. By using distributed tracing, we could follow a single order through every microservice it touched, pinpointing exactly where it slowed down or failed. Latency spikes could now be tied directly to a slow database query, a misbehaving service or even a degraded third-party payment gateway.
Proactive anomaly detection. We also replaced static thresholds with Datadog’s anomaly detection models. These models learned normal patterns — including seasonal variations in traffic — and highlighted deviations early, giving engineers time to act before customers noticed.
Access to dynamic context via MCP and LLM. Finally, we made the platform more accessible by integrating Datadog’s Model Context Protocol (MCP) with GitHub Copilot. This allowed on-call engineers to ask operational questions in plain English — like “Which services had error spikes in the last hour?” — and get direct, actionable results without writing complex queries.
The transformation delivered measurable improvements in both operational efficiency and business performance. By replacing static, noisy alerts with intelligent, context-aware monitors and embedding business metrics into the observability pipeline, the client’s operations shifted from reactive firefighting to proactive prevention.
One of the clearest signs of progress came from rethinking how alerts were defined and triggered:
| Alert | Before | After |
| 5xx error rate | Fired whenever error rate exceeded a static 1%, regardless of traffic volume or impact. | Composite alert that fires only when error rate breaches a dynamic anomaly threshold and request volume exceeds a set minimum, filtering out low-traffic noise |
| Disk space usage | Static threshold at 80% usage, triggering prematurely on large disks with no immediate risk. | Combines disk usage, free inode counts and historical growth rates; fires only when projected to run out within 48 hours, enabling proactive action. |
| Checkout service latency | Alert on p99 latency > 200ms, often triggered by harmless traffic spikes without user impact. | Correlates latency anomalies with user-facing error rate and drop in successful orders; fires only when there’s measurable business impact. |
After the implementation, alerts were reclassified into P1–P4 levels based on business impact, ensuring critical issues received immediate attention while lower-priority ones were addressed without disrupting key workflows. This change cut alert noise by 80%, allowing engineers to focus on genuine incidents and act with clear context. Each alert now includes the information needed to accelerate root cause analysis (RCA), reducing wasted investigation time.
Faster RCA was reinforced by comprehensive dashboards that unify application, infrastructure and AWS service metrics. With a single, consistent view, engineers can isolate issues quickly, assess their business impact in real time, and resolve problems before they disrupt the customer order experience.
On the operational side, the platform overhaul dramatically improved incident handling speed, reduced wasted effort, and enabled proactive intervention before issues became customer-facing.
MTTR reduction. Mean time to resolution dropped by 50% thanks to trace-driven RCA and enriched alert context.
Proactive detection. Learnings from past incidents were built into predictive monitors, such as rate limit and quota alerts at the APIM layer, to prevent recurring issues before they impacted customers.
Streamlined workflows. Alerts were prioritized, contextualized and integrated into clear dashboards, enabling engineers to act without switching tools or digging through siloed data.
From a business perspective, the improvements translated into improved customer experience, higher throughput during peak demand and reduced operational costs.
Customer satisfaction. A 15% decrease in support tickets related to order processing issues.
Order throughput. A 10% increase in successful order completions during peak periods, thanks to proactive resolution of bottlenecks.
Operational cost savings. Roughly 20% fewer engineer hours spent on manual troubleshooting each week, freeing teams to focus on higher-value work.
The shift from a noisy, reactive observability stack to a unified, AI-assisted platform has delivered measurable gains in stability, speed and business outcomes — but this is just the beginning. The new foundation enables deeper automation, richer business–technical correlation and more predictive operations.
Next, we’ll expand anomaly detection to more business-critical workflows, refine composite alerts for complex cross-service patterns and automate remediation for recurring incidents. Early experiments also show promise in using LLMs to let support and product teams query Datadog directly, without engineering help.
Long term, we aim to link observability with code bases, customer sentiment, change management, deployment pipelines and customer-facing systems — closing the loop from detection to resolution to prevention.
In this model, operations evolves from fire-fighting to a true intelligence layer guiding decisions across the business.
Disclaimer: The statements and opinions expressed in this article are those of the author(s) and do not necessarily reflect the positions of Thoughtworks.