


Chris Thelwell is the Winner of the F1® Connectivity Innovation Prize 2014.
A single Formula 1 Grand Prix® generates a huge amount of data. Their teams employ data experts who use this data to make strategic decisions for the teams and drivers. But how could we take this data and use it to engage the wider fan base and reach a new and untapped audience? That’s exactly what I did to win the F1® Connectivity Innovation Prize.
As an experience designer at Thoughtworks and a keen Formula 1® fan, the Connectivity Innovation Prize competition run by Tata Communications piqued my interest. It was the perfect opportunity to get involved in the sport I love - and use the skills I’ve developed in my career.
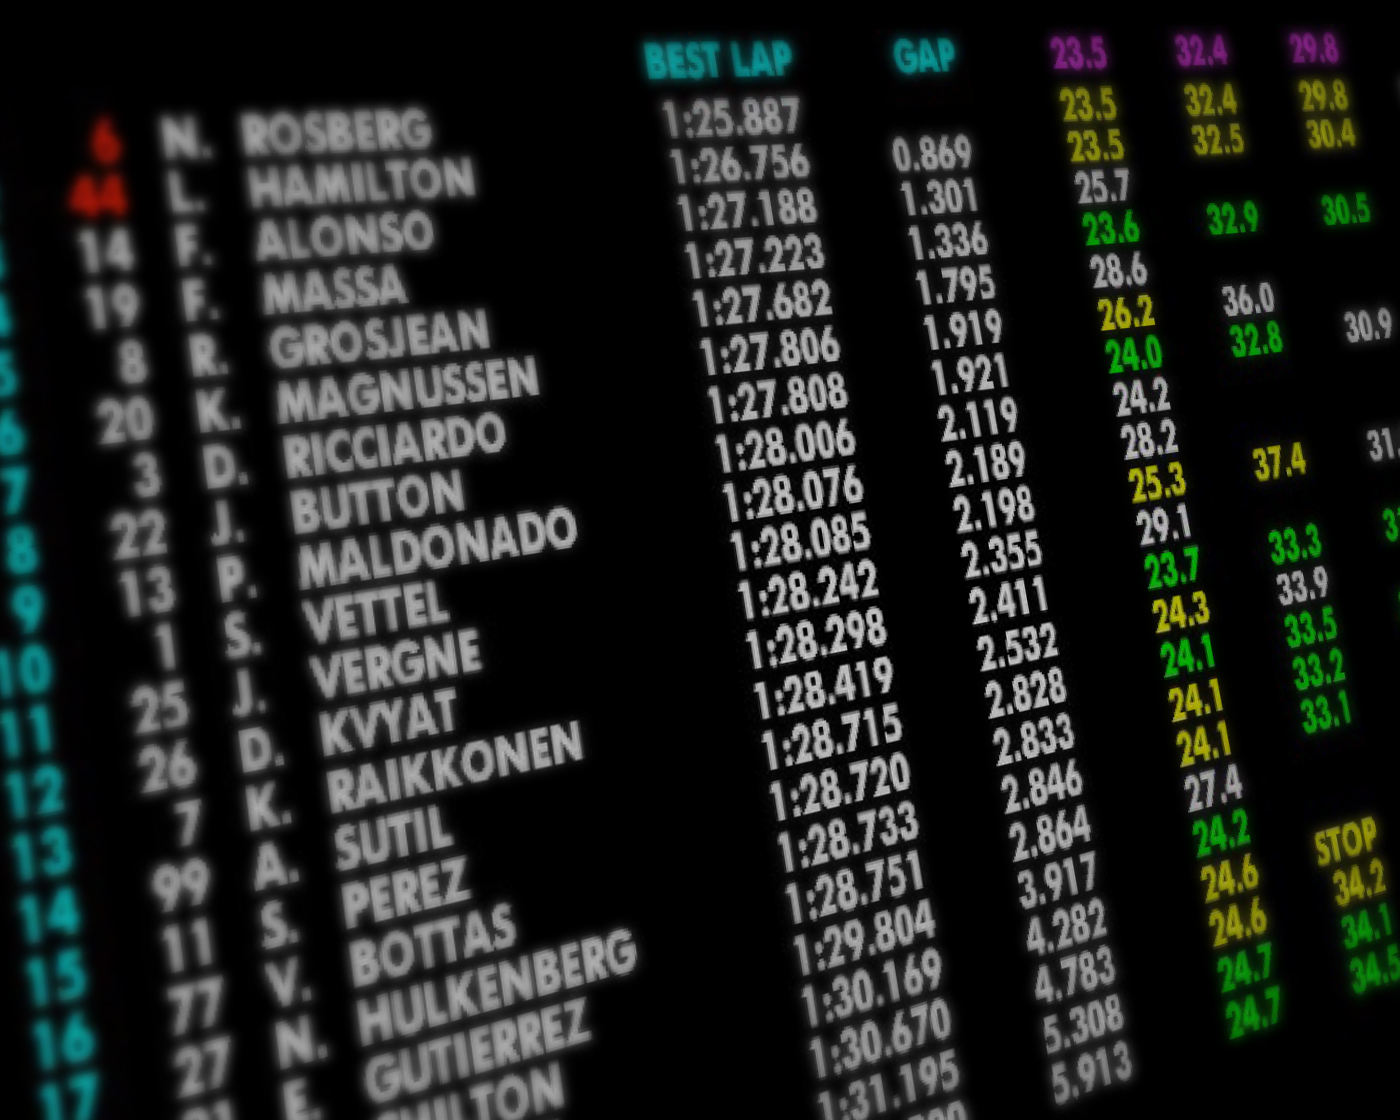
The challenge was quite simple: take Formula 1® Management’s timing data set - which contains all the data behind the lap times, gaps and positions during the race - and propose new and insightful information. Then show how this new information can be delivered visually to add suspense and excitement to the audience experience.

A Different View
The competition presented an opportunity to think differently, creating a new view of how the data is shown and focus on making a real difference to a unique type of user; one that is currently unserved by the current data service.
According to the RNIB there are almost two million people living with sight loss in the UK alone. That’s approximately one person in every 30. This number is likely to double by the year 2050. Almost half of blind and partially sighted people feel ‘moderately’ or ‘completely’ cut off from the people and things around them.
The Formula 1® is a global sport with over half a billion TV viewers - it felt safe to assume that there was a significant number of blind and partially sighted people in the world who have limited access to the sport or feel cut off completely. This presented an opportunity for Formula 1® to create a fully accessible format that would include even more people in the enjoyment of the sport.
A Visual Solution to a Non-visual Problem
I created a new data humanisation service, taking a feed from the Formula 1® timing data and generating humanised stories that bring the race to life in a format that can be used by screen readers and other products and services.

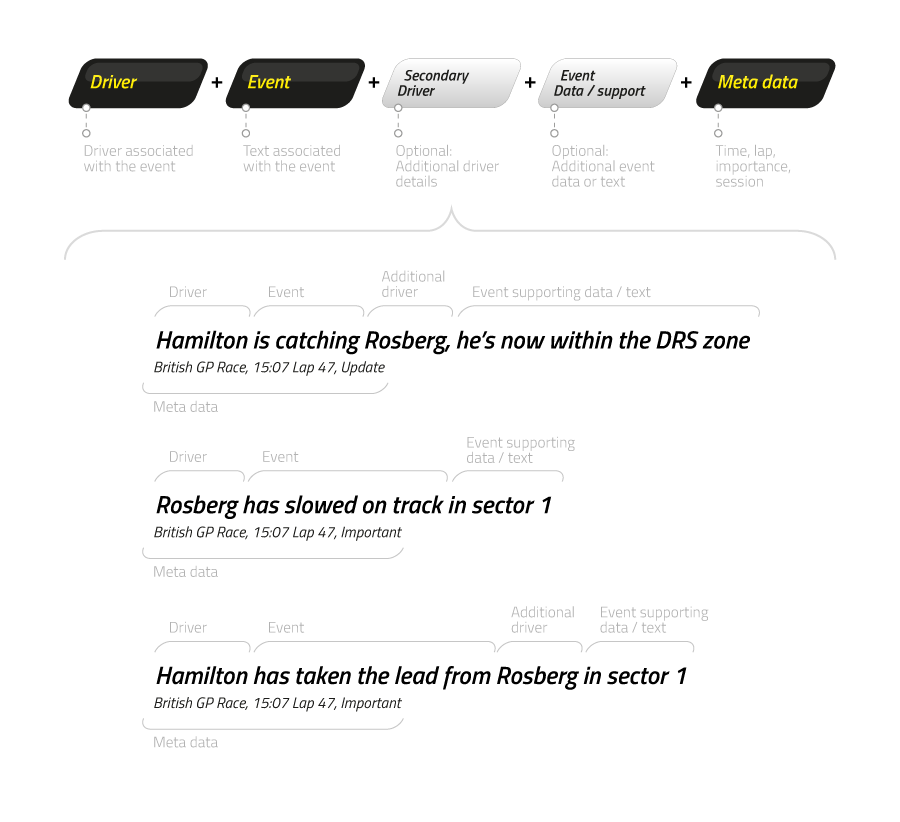
By delivering a feed of data stories in an accessible text format via an open API, the service could also be used to deliver new and exciting ways to experience Formula 1® including:
- Personalised commentary focusing on the drivers or events the fan is interested in
- Data driven race timelines with insight driving historical comparison
- Google Glass or smart watch (ie small screen) data highlights
- Formula 1® data Twitter feeds
- Plus many more
By focusing on a blind user I was forced to think about the problem of delivering vast amounts of data, and visualising it in a completely different format compared to other data visualisation solutions. This not only created a fantastic service for engaging blind or partially sighted Formula 1® fans, but also created new opportunities to deliver the vast data set in completely new formats, creating new ways to experience the sport for all audiences.
My solution also included an open source element that allows third-party developers to use the data story feed to build new and exciting products and services to enhance the experience further. It would also allow the technology behind the service to be used to create other products outside the sport, to make a real difference for blind or partially sighted users.
A full description of the solution can be found on my blog. Want to learn more about The F1® Connectivity Innovation Prize? You can check out the details here.
Disclaimer: The statements and opinions expressed in this article are those of the author(s) and do not necessarily reflect the positions of Thoughtworks.