


Agile analytics is all about failing fast. In a scientific context, this means stating hypotheses and seeking to disprove them using quantitative analysis of real data in rapid cycles. The end result is actionable insight and maximized value to stakeholders. This article is the first in a series where we paint a picture of a Thoughtworks analytics engagement. We'll focus here on the concept of the data lab, where a data science team explores data, hypotheses, and quantitative methodologies to answer core business questions with advanced analytics.
A Picture of an Agile Analytics Engagement
Advanced analytics is an umbrella term that covers a wide swath of tools and techniques, all rooted in rigorous statistics. A data science team is not only able to solve IT problems, but can answer any quantitative question that is at the heart of a business. When visualizing metrics means you can better monitor the health of your business processes and capital, we can design and build out effective, tailored dashboard reporting tools. When you want deeper insight on what drives value for your shareholders, we can analyze a far wider variety of data sources than is typically used in traditional business intelligence. And when you want to increase revenue with targeted recommendations and personalization, we bring expertise in sophisticated machine learning techniques to the table. Wherever it is possible to answer valuable business questions with real data, there is an opportunity to engage a data science team.
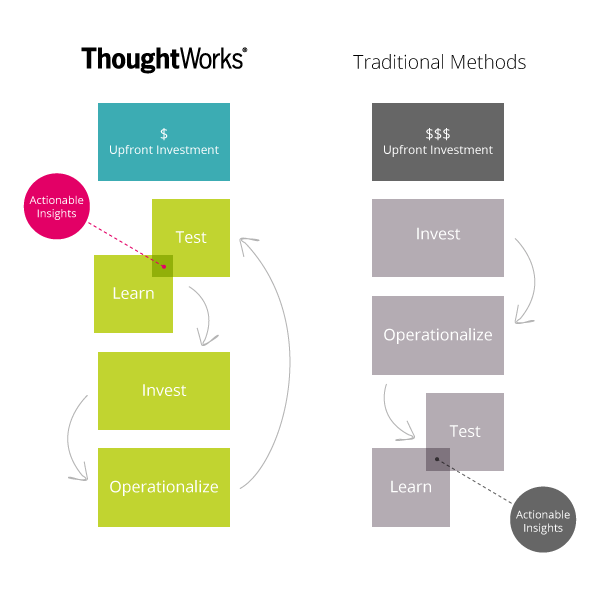
So how might an agile analytics engagement unfold? The following picture illustrates a model for applying agile methodologies to data science analytics.

Discovery in the Data Lab
The upfront, rapid feedback cycle of Test & Learn in this picture involves stakeholders posing business questions and describing available data sets. A team of data scientists, business analysts, software engineers and other experts work with the stakeholders to hone each question until they:
- Have as narrow scope as possible;
- Contain explicitly quantitative clauses;
- Are ranked by relative value; and
- Are potentially answerable given the available data.
In the data lab, the question “Can we extract additional revenue from the logs of user activity on our website?” may be honed to, “Can we increase our online conversion rates from 1.5% to at least 3% by providing targeted recommendations?” The corresponding null hypothesis to be tested in the data lab might look like, “A Mahout singular value decomposition recommendation engine offers no additional conversion beyond what we’re already achieving.”
The data science team then breaks off to dig into the data, seeking to disprove the null hypotheses. In our product recommendation example, this means trying to show that a Mahout Taste implementation achieves a conversion rate that is statistically consistent with 3% or more, and statistically inconsistent with today’s conversion rate of 1.5%. These quantitative requirements impose constraints on the quality and quantity of the data needed to achieve the goal. As this example illustrates, our primary focus in this early data lab stage is to identify the appropriate data set and the minimum sample size to generate observations & insight and maximize value. The questions we answer typically include:
- Is the data we already have appropriate to gain insight into the question asked?
- If not, where and how can we get the data we really need? This may entail proactive data collection.
- What are the variances, covariances, biases and selection functions inherent to the data?
- What is a reasonable and realistic baseline against which to test our hypothesis?
- How much data do we need to reject our hypothesis?
In the data lab, a huge number of visualizations and statistical tests are typically generated to understand the nature and quality of the data sets and the relative merits of different statistical methods. R and Python are our go-to languages for this stage of data exploration, thanks to the huge number of actively supported statistics libraries and the relative brevity of data analysis scripts.
Insights reached in the lab are communicated back to the stakeholders in a rapid cycle, typically every few days to every week. Questions and hypotheses are further honed and potentially new data sources are put on the table. In this upfront feedback cycle, the team reaches deeper insight on how exactly to answer valuable business questions with real data.
Deliverables of the Data Lab
The data lab produces insight on the nature and quality of data sets, business questions and hypotheses that are narrow in scope and answerable, and a concrete selection of tools that can be used to answer those questions with the data. These products come in the form of prototypes and proofs-of-concept. The team gains a deep understanding of the viability of the advanced analytics solution, and what remains is to put the solution into production. We'll explore this in the next article in the series.
This article was co-authored by Anand
Learn more about our Big Data Analytics approach.
Disclaimer: The statements and opinions expressed in this article are those of the author(s) and do not necessarily reflect the positions of Thoughtworks.