
Data strategy
A streamlined developer experience in Data Mesh (Pt. one)

This is the second blog in a two part series exploring how we created a streamlined developer experience in data mesh. You can read part one here, or, if you need more background, learn more about the Data Mesh architecture from a high-level perspective here. Everything here is based on our experience working with a large health care provider.
This blog post demonstrates how a data product developer will interact with the platform at each stage in the data product lifecycle. This will demonstrate what a streamlined developer experience looks like in the context of Data Mesh; ultimately it is important because it helps developers inside a domain team to build better data products, faster.
Before we go further, let’s take a quick look at the data product lifecycle:
Bootstrap — this is where the platform provisions the underlying infrastructure for storage, compute and access for each data product. As an output, scaffolding code and a default specification is provided for the developer to declaratively define the product.
Deployment (or redeployment) — this is where the developer will provide detailed specifications, build data models and develop transformation logic.
Retirement — This is when the data product can be removed from the existing infrastructure (typically because it’s out of date, and no one uses it).
Let’s now take a look at what this lifecycle means in practice in terms of how the data product developer will interact with the platform.
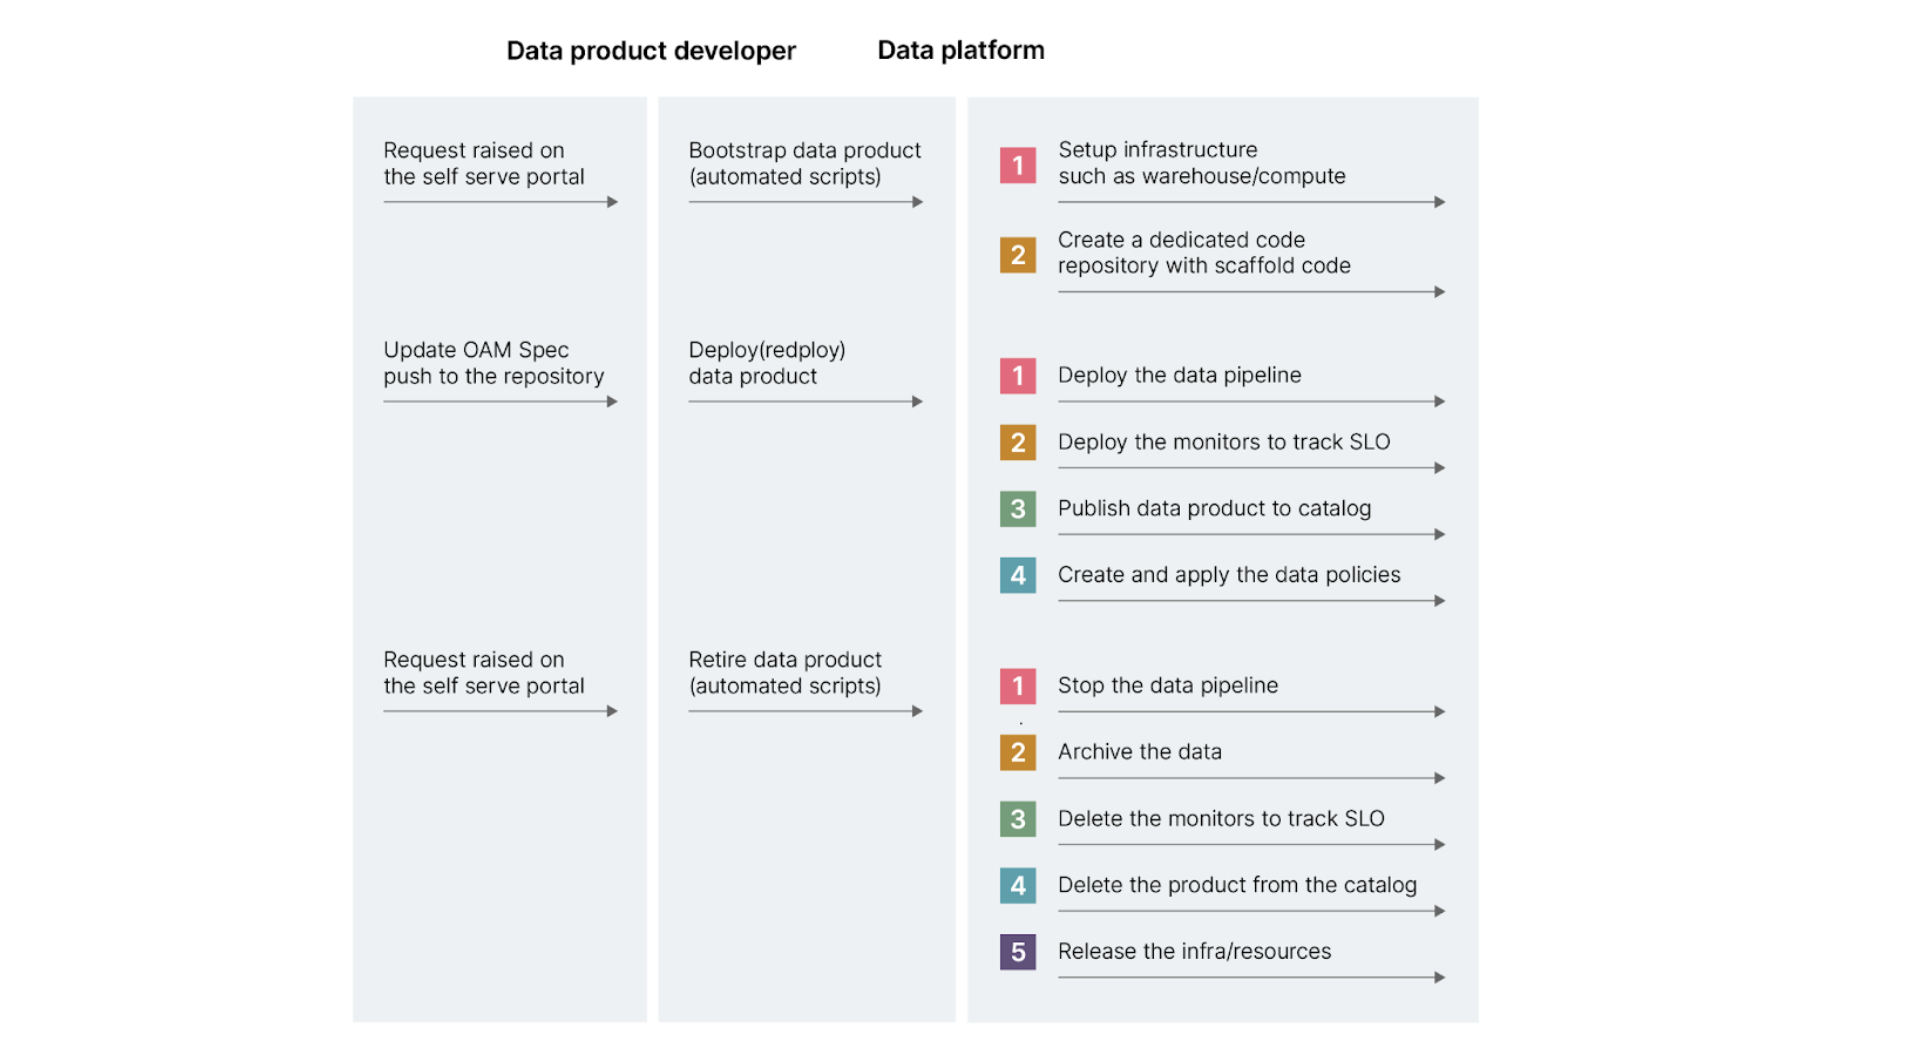
Sequence diagram: data product and platform interaction
To kick things off, the data product developer will raise a request in the self-serve portal to begin creating a data product.
The platform processes the request and does the following:
(Note that for a new data product, the following infrastructure is provisioned using infrastructure-as-code.)
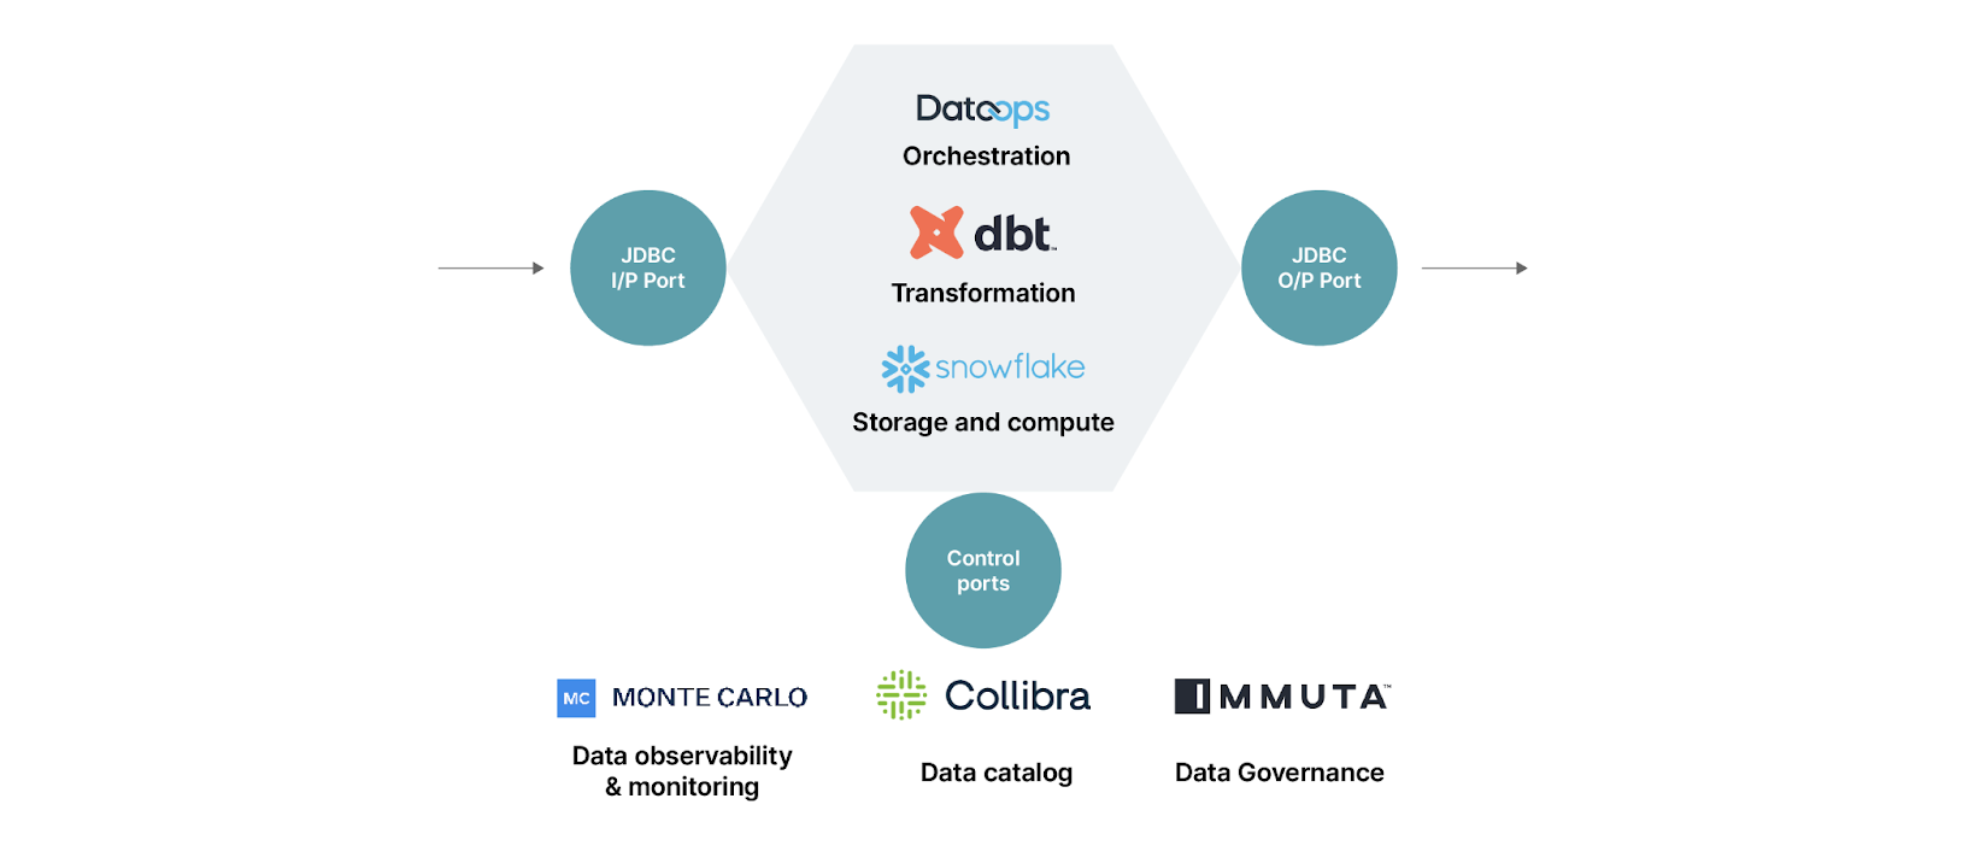
It creates dedicated compute — a Snowflake warehouse, for example,for each domain. A warehouse is the “machine” where execution happens. (The compute resource that is provided by the warehouse at the level of a specific domain is shared by all data products in that domain.)
A schema is then created for each data product. Schema is an isolated namespace on snowflake for data storage.The data that ingested, transformed and served will be stored within a specific schema.
Inside the monitoring platform — in this example Monte Carlo — a namespace is created to hold the monitors and metrics definitions for all the data products within a given domain.
In the catalog — Collibra — a community is created that has access to all the data products within a domain.
Next, three different roles are created for role-based access control:
A Consumer role where you can only read only the output port
A Service role which has permission to read and write all internal data, input and output ports, publish metadata to the catalog, and publish metrics to the monitoring system
An Owner role that can create Data Product metadata, and can access all data and monitor metrics
Additionally, In Dataops.live, a dedicated code repository with scaffold code for each data product is created. This means data products can be deployed independently of each other.
Creating separate repositories for data products lets you deploy data products independently of each other. These repositories hold all the structural elements required for data products to function, as described in Zhamak’s article.
The repository has a starter/scaffold code with two important files data_product_spec.yml and data_product_deploy.yml.

Scaffold code in data product repository
data_product_spec.yml - a declarative Specification for creating the data product.
The data_product_spec.yml is the declarative data product specification defined using OAM specification.
data_product_deploy.yml - deploys the data product and associated steps.
The data_product_deploy.yml is a pipeline template containing stages to build, test and deploy data products. This idea works with any CI/CD by adopting a pipeline-as-code approach.
Additionally, different environments are required to develop, test and release the data products in production.
To automate the creation and maintenance of our environment, we used dataops.live’s SOLE (Snowflake Object Lifecycle Engine) feature. The SOLE engine compiles the declarative configuration to work out dependencies and resolves the environment and namespace to manage specified objects such as schema, tables, roles and grants. This can also be done using pipelines-as-code to compile the declarative configuration and take necessary actions.
To create sandbox environments for feature development, dataops.live automates the creation of the entire environment including data ingestion, modeling and transformation code and then building it by creating a new data warehouse instance that works just like production, also and using snowflake’s zero copy feature for faster bootstrapping.
In this phase, the developer updates the properties of the OAM file based on the data product definition. They additionally add the transformation logic specific to the data product in the code repository.
A push to this repository triggers the CI/CD pipeline to initiate the steps below on the platform:
The data_product_spec that defines every data product is validated to ensure the completeness of the data product definition.
The data_product_spec is then parsed by the Dataops.live pipeline and takes action on each component of the spec by the underlying platform component using the command pattern to perform the action:
Deploying the data pipeline
Creating monitors to track SLO
Publishing data product to catalog
Creating and applying data policies
Data product deployment pipeline components
The data pipeline triggers the ingestion job, which fetches data from source/input ports to the staging area; in our stack this is a Talend job.
The data pipeline is then created to read the data from input ports and apply a series of transformations to create the dataset served via the output port. With Snowflake as the storage layer, the standard/native ports supported are JDBC and APIs.
DBT modules are used to implement the transformation logic and data tests and are executed using dbt_runner.
Data pipelines run on cron-based schedules on Dataops.live . Cron-based schedules are error prone as they rely on assumed time buffers for dependent job completion. In the next iteration we are looking for options to design event based triggers between data products.
The developer will define the service-level-asset definition of OAM spec consisting of SLO and SLIs, the platform creates the monitors based on the specification.
A service-level objective (SLO) is a target that a service or data product should meet to be considered reliable and valuable to its users.Service-level indicators (SLIs), meanwhile, are the metrics used to measure the level of service provided to end users.
We defined SLIs for each SLO of the data product. Some of them are as described below:

Service Level Indicator (SLI) monitoring
Availability
This refers to the uptime of the underlying data set. It’s verified by checking the existence of the underlying table in Snowflake.
The SLI Uptime Indicator is calculated based on an average amount of time in which data product has been available for the past few days. For example, the Hourly data availability indicator over a 20-day rolling period.
Completeness
This helps us ensure that the row count should not be below the known historic threshold.
The SLI Volume Indicator is calculated by comparing the total number of rows of the last update with the average of the past few days update.For example, the SLI has a passing value (in percentage) which represents that whenever the data product has been updated the number of records in it have never fallen above five percent from its last update in the past 20 days.
Freshness
This refers to the refresh time of the underlying data set. It’s verified by checking the update/refresh time on the underlying table in Snowflake.
The SLI Freshness Indicator is calculated based on the average freshness of data for the past few days.For example, the SLI for a daily refresh has a passing value (in percentage) which represents the freshness of the data product in the past 20 days for every day.
Based on the service-level definition in the OAM,the platform creates the monitors using the Monte Carlo CLI programming interface provided by the Montecarlo Platform. A dedicated namespace contains the monitors for a given data product.
It’s worth noting that namespaces isolate/separate a collection of monitors that you are able to define. Monitors from different namespaces are isolated from each other. This helps to:
Avoid conflict or override monitor configurations across data product teams.
Manage monitors across different environments in different pipelines.
SLI computation for each SLO is made by capturing data from monitor job history logs for each monitor using Monte Carlo GraphQL APIs.
Alerts and notifications are sent to the teams in case of any anomaly or deviation from the expected behavior of the data product.
A data product must be made available in the catalog to be discovered by domains across the mesh. A consistent metadata model for data products needs to be defined so it can be used by the entire organization. Data product metadata and data sharing agreements are read from the OAM spec defined by the data product and published to the Collibra catalog in line with the defined metadata model using the Collibra Import APIs.
Note: The Collibra Import API is used to import, update and synchronize large amounts of metadata to the Collibra catalog. It supports JSON, CSV and Excel file formats so you can upload communities, domains, assets or complex relations and characteristics.
Data product metadata can be classified in two ways: static or dynamic metadata:
Static metadata represents properties of the data product that change very little and are not dependent on the execution of the data pipeline. These include the data product name, a description of it, its owner and the domain of which it is a part.
Dynamic metadata continuously changes and is dependent on the data pipeline run. Examples include SLO metrics, schema and data lineage.
Additionally, the data sharing agreements section of the OAM contains instructions on how to gain access to the data product — these are published to the catalog. Consumers can request access to consume the data from output ports.
As part of the developer experience, data product teams should be able to programmatically specify both human and machine user access policy rules. They should be able to employ both role-based access control or attribute-based access control techniques to achieve this.
The platform should support a data sharing workflow and automated execution of these policies with seamless integration between the corporate identity management system (system of records for roles) and the target data storage solution to grant appropriate permissions to the schema and tables.
We are exploring the policy-as-code feature provided by immuta to achieve some of this.
Data Products are redeployed when code has been changed. It’s identical to the Deploy Data Product Phase discussed in the previous section.
The use of data products can be tracked by monitoring metrics such as number of active users accessing the data product . If you were using Snowflake to store the datasets, the number of read queries on the table(dataset) determines its usage.
Based on these metrics, data product developers will then raise a request in the self-serve portal to retire inactive data products.
This requires the platform to run automated scripts to perform the necessary steps:
Stop the data pipeline
Archive the data
Delete the monitors to track SLO
Delete the product from the catalog
Release the infra resources
This helps the platform to use resources more effectively and will reduce the overall cost of maintaining inactive data products.
The Data Mesh Developer Experience Plane provides data product developers with smooth and intuitive developer experiences to reduce lead time to create new data products. It also introduces consistent standards for building data products across the mesh.
Key takeaways
To enable developers to interact with the platform and build data products autonomously, it's important to invest time in defining the data product specification and contract between the platform and the data product developers.
Evolve the design iteratively in small deliverables. Over time perfect the data product specification so it supports all aspects of data product provisioning.
It's important to account for the amount of effort building your dev experience portal will require in the roadmap. This will help you to launch data products faster.
Disclaimer: The statements and opinions expressed in this article are those of the author(s) and do not necessarily reflect the positions of Thoughtworks.