


I am part of this project where we run a pretty big CI Build system. We had been facing a few issues with it and we wanted to do some work around Build Monitoring to improve the system as a whole. The next couple of blogs (written in collaboration with Rohith Rajagopal) will talk about the problems and approaches that we considered. In this post we will describe our build system, the tool we use, general build systems and approaches towards monitoring the Build System.
Our Situation
Most Build system typically consists of Compile -> Unit Tests -> Integration Tests -> Functional Tests(+Smoke) -> Artifacts or CUIFA (I just coined this!). The artifacts are then deployed onto QA environments. We follow something very similar.
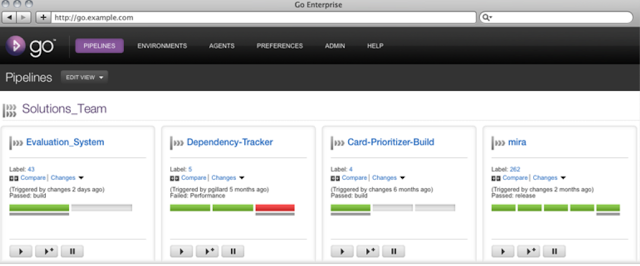
The build tool we use is Thoughtworks' Go, which allows you to define your CI setup as a series of pipelines. Each pipeline allows you to have multiple stages that run in a serial manner. In each stage, you can define multiple jobs, all in parallel. So basically if we have to map CUIFA to this setup, you would define each of them as stages of one build pipeline. If there are multiple modules in your code, you would then define each of them as a job in one of the stages. The diagram below might help you map this.

So getting back to our situation, at any time, we have 3 branches to monitor - the branch that is in production, the branch that is about to be released and the branch that is in development - with each branch roughly consisting of 10-15 pipelines. The jobs across these 30-40 pipelines run on a build farm consisting of approximately 140 Virtual Machines (VM), or Agents, as they are called. (Note: They have nothing to do with James Bond! Bad joke.) On an average a particular pipeline has anywhere between 5 - 40 compile/test jobs that needs to be run in parallel.
Our Challenges
Without churning out metrics and monitoring various aspects of the Build, managing these pipelines was a full time job for the Build team where daily we’d have to keep clicking different pipelines and jobs and trying to get them to go green. This approach isn't completely bad, but results in the possibility of missing out on a lot of metrics and might fail to provide the right insight into your build system. As a result, we've had situations where:
- Builds became slow on some or many agents due to the infrastructure not serving us correctly. One common reason was since we run our builds on VMware, whenever someone brought up a new VM and forgot to run VMware tools on it, that VM would slow down and result in slowing down other VMs on the same server. (There are also several other things that you might have to take care of, including making sure that you don't overprovision your system. That is for another day!)
- Tests on a couple of occasions took 20 minutes or more because a certain proxy was down and we found it out, accidentally, several days later.
Along with being able to take care of the situations above and making the system more predictive in nature, there were 2 other kinds of problems that we wanted to solve:
- Avoid job starvation due to "appropriate" VMs not being available. What do I mean by this? Let’s say that a job is scheduled to run and that this job has been tagged as "app". Go then allocates this job to a particular agent (Agent = VM) that has been tagged or assigned "app". On several occasions, we found that there was tight coupling between the jobs and the agents and that some of them would run only on one or two agents. If that Agent was running any other job, there would be a substantial “wait time” before the job was assigned to an agent. We wanted to improve build times by making sure that jobs weren't starved. This meant that we had to start monitoring wait times for jobs and also build generic build agents.
- How stable is the build and how often do jobs fail? It is imperative that tests are stable, even if builds take a couple of minutes extra. So If I look at the performance of jobs over the duration of a week, I would want to see more green runs than red runs (failures) unless these reds are genuine failures.
How did we go about trying to solve this?
At a high level, irrespective of the build system, we found these steps to be really helpful:
- Start emitting metrics from the build:
What should the granularity be? Depending on the size of your build system, you'll have to decide the granularity. Suppose your build system has 2 jobs - 1 compile job and 1 job - to run all tests, you might want to check how much time each task takes (assuming you have defined your tasks in Ant/Nant) and how much time each test takes. In this case, maybe an addition of 10 seconds to a test indicates "bad code". To implement this, you might have to write scripts or use plugins to emit times per test. In our case, we had a much wider range to play with. We didn't have to measure how much time every test takes. We decided to monitor at a job level, where every job would typically run the compile and all the unit tests. We started to emit these job metrics using a "push" mechanism – the Build server pushed metrics to the Monitoring tool.
How often would you want to emit metrics? If your build lasts less than 10 minutes and you have readily available plugins to do so, then you can start as soon as the pipeline goes green. In our case, we found that a particular pipeline and resultantly all the jobs in that pipeline run, at the maximum 2-3 times per hour. We had a couple of options.
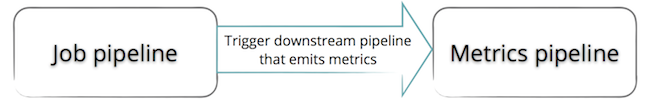
- Have a downstream pipeline that gets triggered once a pipeline goes green as shown below:


OR
- Run a cronjob after X minutes. We chose the cronjob approach instead, as we tried the above approach and one of the reasons we didn't go through with it was because you need to have a VM to run the metrics pipeline. The cronjob approach also suited us because we didn't run more than 2 builds per hour on an average.
- Collect metrics - Once you publish your metrics, you need to find a stable monitoring system that meets your needs. You can talk to your Operations team and either reuse whatever they are using or get yourself a stable monitoring system that collects these metrics. Nagios, Zabbix, Zenoss, Ganglia, Graphite, Munin are some popular tools in this space that you could try. Its important that the monitoring system has an easy way to collect metrics - either through SNMP/Monitoring Agent/Plugin architecture etc. Our recommendation is to preferably choose a system that allows both "Pull" and "Push" as it gives you the flexibility of deciding what method you want to use to collect which metric.
- Alert - Once your monitoring system collects metrics, the next important thing is to alert the concerned people when certain thresholds have been crossed. I've found that Nagios has an extremely mature Alerting system. So you could run other tools for monitoring but use Nagios just for alerting. It allows you to define "Contact Groups" and send emails or pagers based on these checks. So for example, I can email the System Admin team when CPU and Memory cross certain thresholds, but if I don't get more than 5 green builds per day when I have 20 checkins, I'll email the Technical lead or the Project Manager. The alerting system you choose should have these capabilities.
- Constantly Refine – It would be tough to expect that in the first shot you would get all the above 3 in place. It’s a process that you keep refining. There is definitely some amount of engineering that goes into this!

We have followed the above 4 steps as part of our attempt to define the monitoring system. Check out Part 2 where we discuss the exact tools and workflows we used for our build system.
Disclaimer: The statements and opinions expressed in this article are those of the author(s) and do not necessarily reflect the positions of Thoughtworks.