


Continuous improvement and product flow are popular themes on the Mingle team. Both internally as we reflect on our own development practices, and externally as we build an agile project management tool that helps teams collaborate and improve together. To help us better understand our flow and gain more insight into ways we can improve, we’ve started to incorporate cycle time into our team conversations.
Back in December we talked about how we rearranged our process and our card wall to improve our flow. We sensed that these changes helped improve our flow, but to be sure we took a look at our actual cycle time to see if what we felt was true.
We used the new cycle time analysis feature available in Mingle on the cloud to confirm what we suspected: our cycle time did improve.

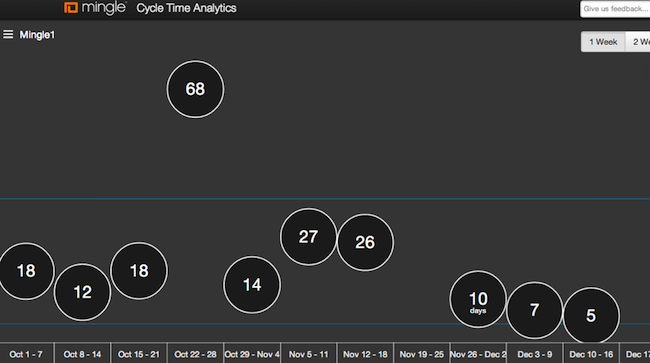
As the image above shows, in the period from October through November, our average cycle time crept up above 20 days before we made changes to our process. After we streamlined our wall, our wait time was reduced and our cycle time fell below 10 days.
Of course to get a full picture with enough context to feel confident in our changes we also verified that our throughput and average story size remained about the same during the period over which our cycle time was reduced. This wasn’t a rigorous scientific experiment because we’re not looking for statistically significant results. We’re only looking for a signal that the actions we’ve taken have helped us improve and based on our needs we have enough evidence to justify making our process changes permanent.
Understanding our cycle time is a useful method in our continuous improvement efforts. However, we also realize cycle time is a trailing indicator. We’d love to use a leading indicator (such as queue size) in conjunction with cycle time to help us improve even faster. More on that later. ;)
Deliver faster with Mingle + Cycle Time Analytics. It's free for up to 5 users. Start now!
Disclaimer: The statements and opinions expressed in this article are those of the author(s) and do not necessarily reflect the positions of Thoughtworks.