Generative AI
From alert fatigue to AIOps: Building a proactive observability stack with Datadog on EKS

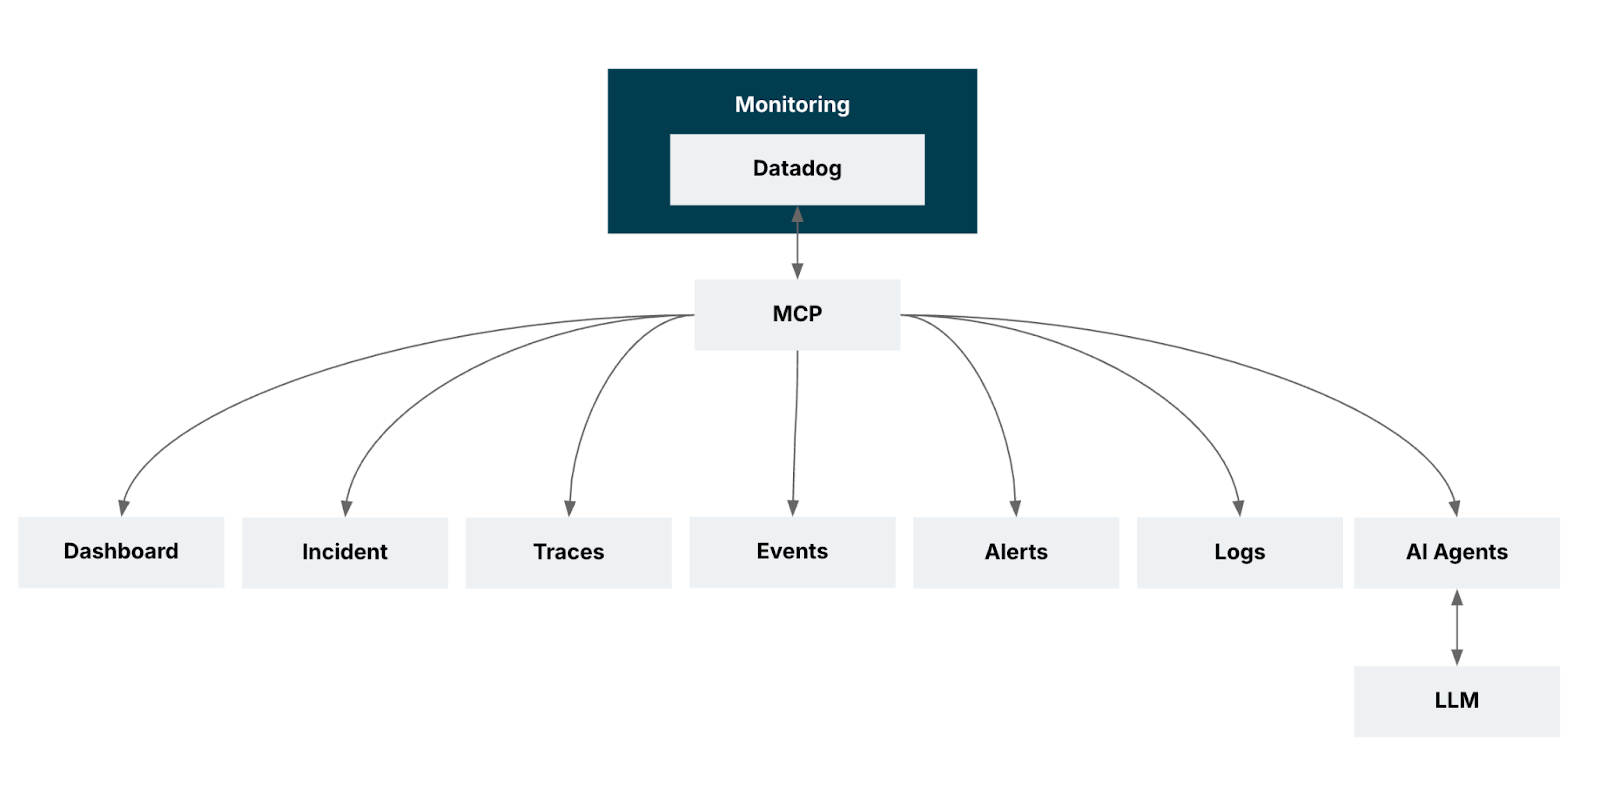
The Model Context Protocol can play an important role in improving the way AI supports monitoring in manufacturing IT operations. This is because it helps bring together natural language interaction, intelligent data mapping and actionable observability.
Imagine it’s a busy day across manufacturing facilities and digital platforms. There are orders coming in, inventory is moving around, and prices are continually adjusting according to consumer demand. Beneath the surface, your IT systems are pulsing with data; every decision you make requires you to see the full picture. This is where the Model Context Protocol (MCP) steps in, weaving together AI’s intelligence and the razor-sharp clarity of observability.
Picture a support engineer trying to find errors from Redis from, say, the last hour. This is exactly the kind of workflow the Datadog MCP Server is designed to simplify by acting as an intelligent bridge between natural-language questions and the underlying Datadog observability stack.
Typically, answering that question would require an engineer to juggle various dashboards and dive into APIs; with MCP such a request can be made through natural language that natural request glides across the MCP server: show me the errors from the Redis service from the last hour. Instantly, it is translated and mapped to the right Datadog tools. This means the request can be returned incredibly quickly; the engineer receives concise error logs, key patterns or a snapshot of the dashboard itself.
The result is that problems that would otherwise be buried in substantial noise can be identified surprisingly quickly. That makes it possible to analyze or act — whether you’re an engineer or an AI agent.
As your applications hit production, these kind of practical concerns multiply further:
Is the knowledge search running as fast as promised?
Are machine learning predictions still accurate or drifting?
Is an anomaly a blip or a sign of underlying bias?
That’s the big picture of what MCP can offer us. But how does it work? Let’s take a look.
1. Input
Users — or even AI agents — can issue plain language requests like: Find errors from redis server.
2. Processing
The MCP Server receives the request and uses predefined schemas and tool specifications to determine which Datadog API endpoint or tool should handle it. It relies on structured mappings and capabilities defined within the MCP tooling framework to route the request to the appropriate Datadog resource.
3. Output
The server returns structured, relevant results, such as a filtered list of error logs or a snapshot of a dashboard. This helps users or agents quickly analyze issues and respond.
Gone are the days of juggling dashboards, manually stitching logs to infrastructure metrics. MCP integrates seamlessly with Datadog, pulling everything — application performance, health, errors, infrastructure — into one powerful, actionable view.
For SRE, this means:
Every prediction, every transaction and every anomaly is tracked with full context.
Accelerated response times. While some issues will still require deeper investigation, MCP removes much of the initial “detective work” by presenting the most relevant signals upfront.
In short, MCP transforms your retail IT monitoring from fragmented supervision into a living, breathing narrative — where every request and every event, is part of a bigger story, and AI-backed insights drive not just troubleshooting, but real progress and innovation.
There are four key benefits:
Real-time observability. You gain immediate visibility into ML predictions and operational signals as they occur, enabling teams to spot issues at the moment they emerge — not after dashboards refresh or jobs complete.
Context-aware debugging. You can now go beyond simply viewing everything together; MCP helps surface relationships between logs, traces and metrics so engineers can quickly understand what triggered a failure, not just where it appeared.
Unified AIOps integration. You can now bring machine learning monitoring into the same workflow as operational monitoring so that anomalies, model behavior, and infrastructure conditions can be evaluated together — enabling smarter automation and AI-driven insights.
Optimized dashboards and monitors mean you can leverage MCP-generated insights to refine dashboards and alerts, improving signal-to-noise ratios and ensuring teams focus on the right KPIs, rather than being overwhelmed by raw data.
Recognizing the need for holistic and actionable monitoring — where every prediction, infrastructure metric and operational detail matters — we set out to implement Datadog MCP within our environment.
Our goal was to streamline troubleshooting, improve dashboard efficiency and bring together machine learning insights and infrastructure data into a seamless workflow.
We aimed to not only monitor application performance more effectively, but also empower our teams to proactively address issues, accelerate root cause analysis and elevate the overall health and reliability of our production systems.
Operation | Description | Additional Details |
search_datadog_logs | Retrieve logs | Debugging, RCA, incident correlation |
search_datadog_spans | Investigate APM spans | trace request paths, latency, performance bottlenecks |
get_datadog_trace | Get spans for a specific trace | deep-dive distributed transactional analysis |
search_datadog_metrics, get_datadog_metric | List and query metrics | performance monitoring and anomaly detection |
search_datadog_monitors | Retrieve monitor configurations | review alert rules, thresholds, and monitor status |
search_datadog_incidents, get_datadog_incident | Manage and track incidents | context for ongoing/resolved incidents |
search_datadog_dashboards | Explore dashboards | visualize metrics, logs, and alerts |
search_datadog_hosts | View host info | infrastructure inventory, status, and troubleshooting |
There are many use cases for Datadog’s Model Context Protocol (MCP) server.
Log anomaly detection.
Pinpointing latency issues in microservices by analyzing spans.
Correlating trace data with logs and metrics to find the source of application errors.
Predicting future trends for metrics like CPU and memory usage.
Reviewing and updating monitor thresholds to reduce false positives or missed alerts.
Using NLP and clustering to group, categorize, and prioritize incidents automatically.
Analyzing dashboard usage to suggest improvements.
Training models on host-level metrics to predict failures and plan preventive actions.
Since GA, the Datadog MCP Server now supports a significantly larger set of tools, see the full list in the official documentation.
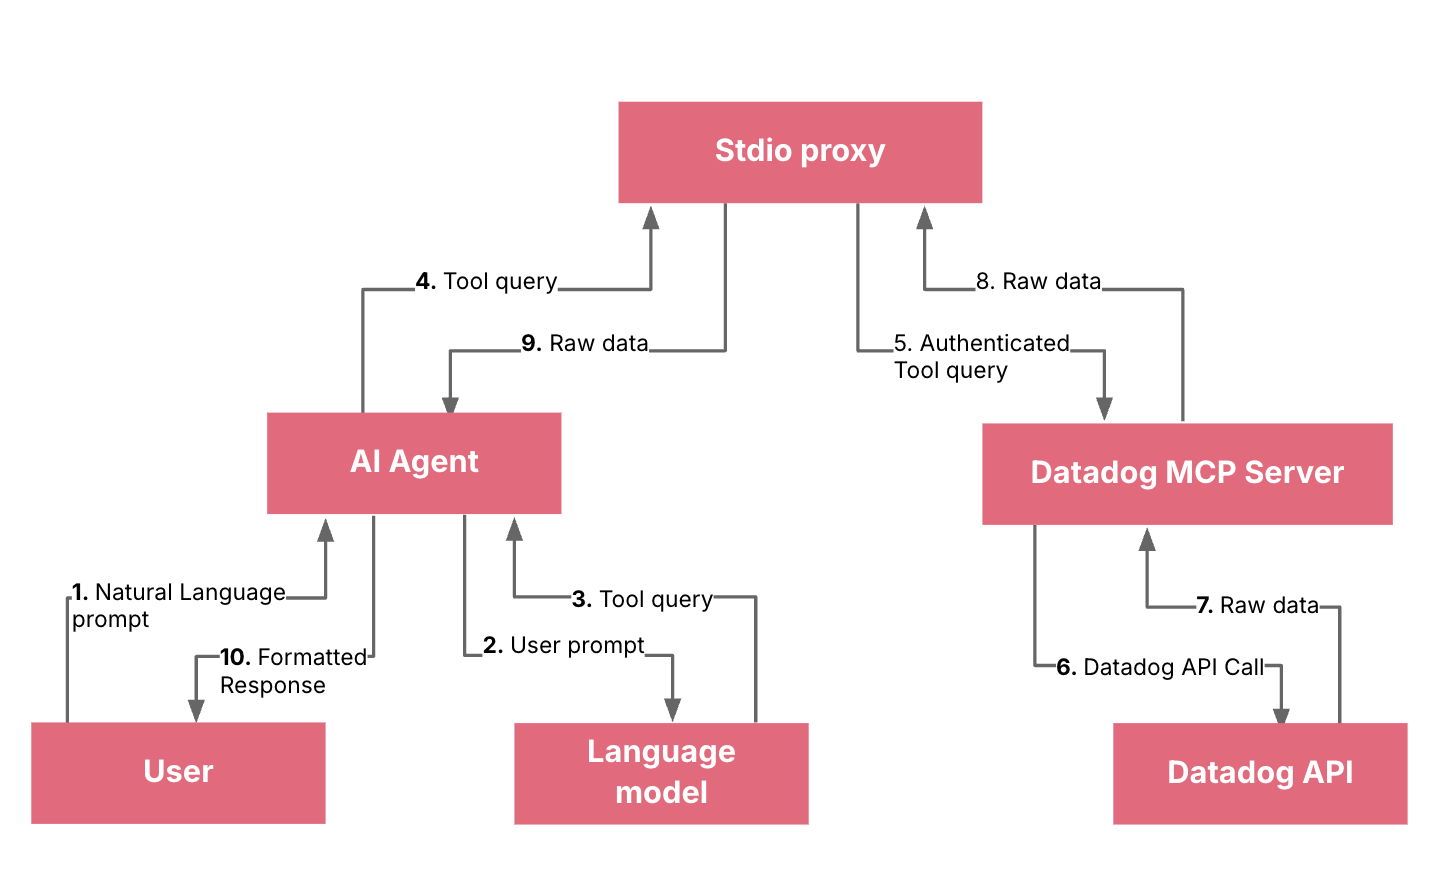
It’s worth understanding the key components and workflow.
You (the developer): The user who provides natural language prompts.
AI Agent (e.g., GitHub Copilot): Your client application (in this case, VS Code with Copilot) that intercepts your natural language prompts and sends them to a Language Model.
Language Model (LLM): The core AI that understands your natural language prompt. It is responsible for parsing your request and determining if a specific tool is needed to fulfill the request.
Datadog MCP Server: A remote server that acts as a bridge between the LLM and the Datadog API. It exposes a set of "tools" (like get_metrics, search_datadog_logs, etc.) that the LLM can call.
stdio proxy (datadog_mcp_cli): A local binary that runs on your machine. Its purpose is to handle the authentication flow (the OAuth process) on your behalf and securely pass requests and responses between the AI agent and the remote MCP server.
Note: The recommended way of using the Datadog MCP Server is via IDE (list of supported IDEs) or direct HTTP connections over OAuth 2.0. The stdio proxy is a fallback for when remote authentication isn't available.
Datadog API: The official API that provides access to your Datadog account's data (metrics, logs, traces, etc.).
Datadog MCP now supports two authentication options: remote authentication via OAuth 2.0 over HTTP transport, and API key plus application key authentication via HTTP headers. OAuth 2.0 is well-suited for interactive access because it uses a consent-driven authorization flow, while header-based keys are a strong fit for automated integrations and controlled service access.
In practical terms, OAuth reduces direct credential handling by exchanging user authorization for tokens, whereas API and application keys are sent as DD-API-KEY and DD-APPLICATION-KEY headers to access Datadog APIs programmatically.
It is critical to review the official requirements for the Datadog MCP Server. For access to the most up-to-date information, including disclaimers on data collection and the HIPAA eligibility notice, please consult the official Datadog MCP Server documentation and disclaimers section.
You provide a prompt: You type a natural language prompt in your VS Code chat window, such as "Show me the error logs from the nginx service in the last hour."
The AI Agent sends the prompt to the LLM: Your client (GitHub Copilot) sends this prompt to the underlying large language model.
The LLM identifies the need for a tool: The LLM processes your request and understands that it needs to retrieve logs. It recognizes that a specific tool, like search_datadog_logs, is required to fulfill this request. It then generates a standardized query for this tool, for example, something like search_datadog_logs(query='service:nginx status:error', timeframe='1 hour').
The AI Agent sends the tool query to the stdio proxy: The Copilot client is configured to use the local datadog_mcp_cli (stdio proxy) as the interface to the Datadog MCP server. It sends the search_datadog_logs tool query to this local proxy.
The stdio proxy forwards the query to the remote MCP server: The proxy, having already completed the OAuth authentication, has the necessary permissions. It securely forwards the search_datadog_logs request to the remote Datadog MCP server.
The MCP server calls the Datadog API: The Datadog MCP server receives the search_datadog_logs request, validates it, and translates it into a standard Datadog API call to fetch the required log data.
The Datadog API returns data to the MCP server: The Datadog API returns the requested logs to the MCP server.
The MCP server returns the data to the stdio proxy: The MCP server sends the raw log data back to your local proxy.
The stdio proxy returns the data to the AI Agent: The local proxy forwards the raw log data to the GitHub Copilot client in VS Code.
The AI Agent displays the response: GitHub Copilot receives the data and presents it to you in a human-readable, conversational format, fulfilling your initial request.
Adopting the Datadog MCP Server changed how we interact with observability data. Before MCP, answering operational related questions required navigating multiple dashboards, manually stitching logs, metrics and traces, and relying heavily on individual expertise. With MCP, we learned that the real value lies in its ability to turn natural-language questions into precise, multi-source insights — instantly.
Through our integration, we saw firsthand how MCP streamlines day-to-day operations. We observed substantial improvements in our ability to monitor predictions alongside infrastructure usage, correlate failures with specific logs and traces and optimize dashboards for faster insights. Instead of juggling tools, engineers could focus directly on problem-solving.
We also learned how seamless AIOps integration enables ML and operational data to coexist without silos, allowing teams to make decisions based on a unified data story. This shift — reducing cognitive load, surfacing context automatically and accelerating root-cause discovery — was the core of the transformation.
Ultimately, MCP strengthened our IT operations by enabling faster anomaly response and more scalable monitoring practices. It made data-driven operations not just possible, but practical, repeatable, and impactful, reshaping how our teams think about observability.
Disclaimer: The statements and opinions expressed in this article are those of the author(s) and do not necessarily reflect the positions of Thoughtworks.